Clostridium sp. CAG:1193
Taxonomy: cellular organisms; Bacteria; Terrabacteria group; Firmicutes; Clostridia; Eubacteriales; Clostridiaceae; Clostridium; environmental samples
Average proteome isoelectric point is 6.66
Get precalculated fractions of proteins
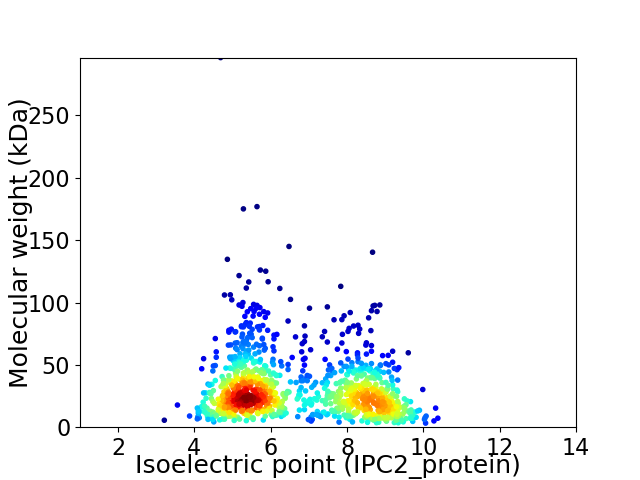
Virtual 2D-PAGE plot for 1080 proteins (isoelectric point calculated using IPC2_protein)
Get csv file with sequences according to given criteria:
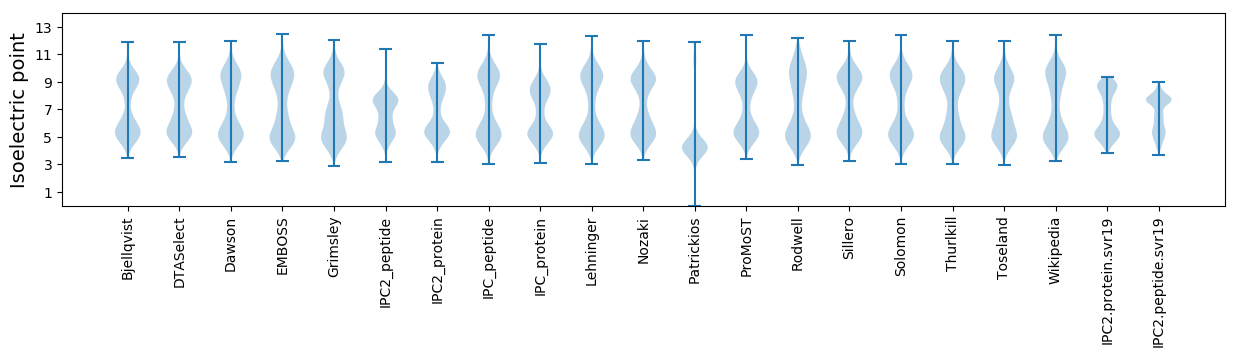
* You can choose from 21 different methods for calculating isoelectric point
Summary statistics related to proteome-wise predictions
Protein with the lowest isoelectric point:
>tr|R5J7M4|R5J7M4_9CLOT Stage 0 sporulation protein A homolog OS=Clostridium sp. CAG:1193 OX=1262771 GN=BN475_01028 PE=4 SV=1
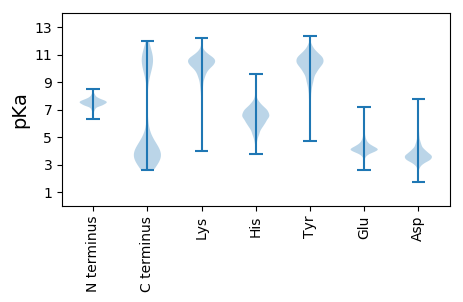
MM1 pKa = 7.37FKK3 pKa = 10.39VDD5 pKa = 3.51KK6 pKa = 9.64EE7 pKa = 4.11KK8 pKa = 11.15CIGCGACVGTCDD20 pKa = 4.93NVFDD24 pKa = 5.67FDD26 pKa = 5.48DD27 pKa = 5.34DD28 pKa = 3.6NLAYY32 pKa = 10.61VKK34 pKa = 10.28NQPNNEE40 pKa = 4.04NEE42 pKa = 4.06NLAIEE47 pKa = 4.56AMEE50 pKa = 4.28NCPTNAIEE58 pKa = 5.36KK59 pKa = 9.47EE60 pKa = 4.13
MM1 pKa = 7.37FKK3 pKa = 10.39VDD5 pKa = 3.51KK6 pKa = 9.64EE7 pKa = 4.11KK8 pKa = 11.15CIGCGACVGTCDD20 pKa = 4.93NVFDD24 pKa = 5.67FDD26 pKa = 5.48DD27 pKa = 5.34DD28 pKa = 3.6NLAYY32 pKa = 10.61VKK34 pKa = 10.28NQPNNEE40 pKa = 4.04NEE42 pKa = 4.06NLAIEE47 pKa = 4.56AMEE50 pKa = 4.28NCPTNAIEE58 pKa = 5.36KK59 pKa = 9.47EE60 pKa = 4.13
Molecular weight: 6.68 kDa
Isoelectric point according different methods:
Protein with the highest isoelectric point:
>tr|R5J7Z0|R5J7Z0_9CLOT 30S ribosomal protein S20 OS=Clostridium sp. CAG:1193 OX=1262771 GN=rpsT PE=3 SV=1
MM1 pKa = 7.69RR2 pKa = 11.84KK3 pKa = 9.46VEE5 pKa = 4.2AYY7 pKa = 10.6VNGVGPARR15 pKa = 11.84DD16 pKa = 3.18TALRR20 pKa = 11.84SLQTGGLEE28 pKa = 4.01VTAMSDD34 pKa = 3.37VTPIPHH40 pKa = 6.45NGCRR44 pKa = 11.84PPKK47 pKa = 9.98RR48 pKa = 11.84PRR50 pKa = 11.84GG51 pKa = 3.65
MM1 pKa = 7.69RR2 pKa = 11.84KK3 pKa = 9.46VEE5 pKa = 4.2AYY7 pKa = 10.6VNGVGPARR15 pKa = 11.84DD16 pKa = 3.18TALRR20 pKa = 11.84SLQTGGLEE28 pKa = 4.01VTAMSDD34 pKa = 3.37VTPIPHH40 pKa = 6.45NGCRR44 pKa = 11.84PPKK47 pKa = 9.98RR48 pKa = 11.84PRR50 pKa = 11.84GG51 pKa = 3.65
Molecular weight: 5.46 kDa
Isoelectric point according different methods:
Peptides (in silico digests for buttom-up proteomics)
Below you can find in silico digests of the whole proteome with Trypsin, Chymotrypsin, Trypsin+LysC, LysN, ArgC proteases suitable for different mass spec machines.| Try ESI |
 |
|---|
| ChTry ESI |
|
|---|
| ArgC ESI |
|
|---|
| LysN ESI |
|
|---|
| TryLysC ESI |
|
|---|
| Try MALDI |
|
|---|
| ChTry MALDI |
|
|---|
| ArgC MALDI |
|
|---|
| LysN MALDI |
|
|---|
| TryLysC MALDI |
|
|---|
| Try LTQ |
|
|---|
| ChTry LTQ |
|
|---|
| ArgC LTQ |
|
|---|
| LysN LTQ |
|
|---|
| TryLysC LTQ |
|
|---|
| Try MSlow |
|
|---|
| ChTry MSlow |
|
|---|
| ArgC MSlow |
|
|---|
| LysN MSlow |
|
|---|
| TryLysC MSlow |
|
|---|
| Try MShigh |
|
|---|
| ChTry MShigh |
|
|---|
| ArgC MShigh |
|
|---|
| LysN MShigh |
|
|---|
| TryLysC MShigh |
|
|---|
General Statistics
Number of major isoforms |
Number of additional isoforms |
Number of all proteins |
Number of amino acids |
Min. Seq. Length |
Max. Seq. Length |
Avg. Seq. Length |
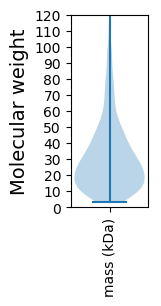
Avg. Mol. Weight |
|---|---|---|---|---|---|---|---|
0 |
309167 |
29 |
2727 |
286.3 |
32.7 |
Amino acid frequency
Ala |
Cys |
Asp |
Glu |
Phe |
Gly |
His |
Ile |
Lys |
Leu |
|---|---|---|---|---|---|---|---|---|---|
4.176 ± 0.069 | 1.114 ± 0.033 |
6.244 ± 0.064 | 7.069 ± 0.075 |
4.125 ± 0.056 | 5.332 ± 0.082 |
1.202 ± 0.03 | 10.394 ± 0.105 |
10.134 ± 0.089 | 9.011 ± 0.09 |
Met |
Asn |
Gln |
Pro |
Arg |
Ser |
Thr |
Val |
Trp |
Tyr |
|---|---|---|---|---|---|---|---|---|---|
2.495 ± 0.033 | 7.637 ± 0.093 |
2.361 ± 0.039 | 1.592 ± 0.033 |
3.026 ± 0.046 | 6.566 ± 0.07 |
5.491 ± 0.088 | 6.294 ± 0.059 |
0.513 ± 0.021 | 5.215 ± 0.066 |
Most of the basic statistics you can see at this page can be downloaded from this CSV file
See this proteome in:

Proteome-pI is available under Creative Commons Attribution-NoDerivs license, for more details see here
| Reference: Kozlowski LP. Proteome-pI 2.0: Proteome Isoelectric Point Database Update. Nucleic Acids Res. 2021, doi: 10.1093/nar/gkab944 | Contact: Lukasz P. Kozlowski |