Simian immunodeficiency virus SIV-mnd 2
Taxonomy: Viruses; Riboviria; Pararnavirae; Artverviricota; Revtraviricetes; Ortervirales; Retroviridae; Orthoretrovirinae; Lentivirus; Simian immunodeficiency virus; Simian immunodeficiency virus - mnd
Average proteome isoelectric point is 7.02
Get precalculated fractions of proteins
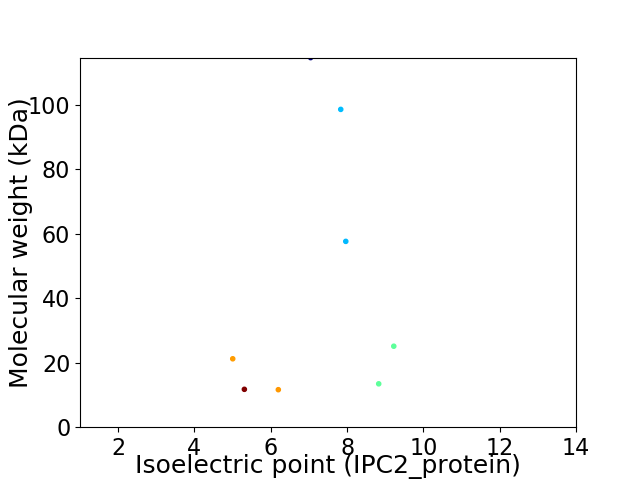
Virtual 2D-PAGE plot for 8 proteins (isoelectric point calculated using IPC2_protein)
Get csv file with sequences according to given criteria:
* You can choose from 21 different methods for calculating isoelectric point
Summary statistics related to proteome-wise predictions

Protein with the lowest isoelectric point:
>tr|Q8AII4|Q8AII4_SIV Envelope glycoprotein gp160 OS=Simian immunodeficiency virus SIV-mnd 2 OX=159122 GN=env PE=4 SV=1
MM1 pKa = 7.45GGKK4 pKa = 9.25SSKK7 pKa = 8.26QQEE10 pKa = 4.34EE11 pKa = 5.26KK12 pKa = 10.16YY13 pKa = 10.44LKK15 pKa = 9.99YY16 pKa = 10.16YY17 pKa = 10.39KK18 pKa = 10.74AMRR21 pKa = 11.84RR22 pKa = 11.84GYY24 pKa = 9.97GAEE27 pKa = 4.12GTNGDD32 pKa = 4.11YY33 pKa = 10.62QQLHH37 pKa = 6.15ASEE40 pKa = 4.83PLLGALSTSQEE51 pKa = 3.96EE52 pKa = 4.15FDD54 pKa = 4.78RR55 pKa = 11.84EE56 pKa = 4.29QKK58 pKa = 10.68SSSTDD63 pKa = 3.27EE64 pKa = 4.15EE65 pKa = 4.89EE66 pKa = 4.11EE67 pKa = 4.18TGFPVYY73 pKa = 9.07PQCPVRR79 pKa = 11.84EE80 pKa = 4.21PTYY83 pKa = 10.99KK84 pKa = 10.73DD85 pKa = 3.77LVDD88 pKa = 3.72MPHH91 pKa = 6.39FLKK94 pKa = 10.83EE95 pKa = 3.94KK96 pKa = 10.59GGLEE100 pKa = 4.56GIWHH104 pKa = 5.85SKK106 pKa = 8.98RR107 pKa = 11.84RR108 pKa = 11.84EE109 pKa = 4.06EE110 pKa = 5.02ILDD113 pKa = 4.22LYY115 pKa = 10.06AQNEE119 pKa = 4.25WGFIPTWQSYY129 pKa = 8.92TDD131 pKa = 4.01GPGIRR136 pKa = 11.84YY137 pKa = 7.55PKK139 pKa = 9.6TFRR142 pKa = 11.84FLFKK146 pKa = 10.07LCPVAVPPDD155 pKa = 3.6QEE157 pKa = 4.69NNEE160 pKa = 4.4CNKK163 pKa = 10.16LLQSSQLGIQEE174 pKa = 4.09EE175 pKa = 4.7SLGRR179 pKa = 11.84EE180 pKa = 3.85ASVEE184 pKa = 4.14VV185 pKa = 3.72
MM1 pKa = 7.45GGKK4 pKa = 9.25SSKK7 pKa = 8.26QQEE10 pKa = 4.34EE11 pKa = 5.26KK12 pKa = 10.16YY13 pKa = 10.44LKK15 pKa = 9.99YY16 pKa = 10.16YY17 pKa = 10.39KK18 pKa = 10.74AMRR21 pKa = 11.84RR22 pKa = 11.84GYY24 pKa = 9.97GAEE27 pKa = 4.12GTNGDD32 pKa = 4.11YY33 pKa = 10.62QQLHH37 pKa = 6.15ASEE40 pKa = 4.83PLLGALSTSQEE51 pKa = 3.96EE52 pKa = 4.15FDD54 pKa = 4.78RR55 pKa = 11.84EE56 pKa = 4.29QKK58 pKa = 10.68SSSTDD63 pKa = 3.27EE64 pKa = 4.15EE65 pKa = 4.89EE66 pKa = 4.11EE67 pKa = 4.18TGFPVYY73 pKa = 9.07PQCPVRR79 pKa = 11.84EE80 pKa = 4.21PTYY83 pKa = 10.99KK84 pKa = 10.73DD85 pKa = 3.77LVDD88 pKa = 3.72MPHH91 pKa = 6.39FLKK94 pKa = 10.83EE95 pKa = 3.94KK96 pKa = 10.59GGLEE100 pKa = 4.56GIWHH104 pKa = 5.85SKK106 pKa = 8.98RR107 pKa = 11.84RR108 pKa = 11.84EE109 pKa = 4.06EE110 pKa = 5.02ILDD113 pKa = 4.22LYY115 pKa = 10.06AQNEE119 pKa = 4.25WGFIPTWQSYY129 pKa = 8.92TDD131 pKa = 4.01GPGIRR136 pKa = 11.84YY137 pKa = 7.55PKK139 pKa = 9.6TFRR142 pKa = 11.84FLFKK146 pKa = 10.07LCPVAVPPDD155 pKa = 3.6QEE157 pKa = 4.69NNEE160 pKa = 4.4CNKK163 pKa = 10.16LLQSSQLGIQEE174 pKa = 4.09EE175 pKa = 4.7SLGRR179 pKa = 11.84EE180 pKa = 3.85ASVEE184 pKa = 4.14VV185 pKa = 3.72
Molecular weight: 21.23 kDa
Isoelectric point according different methods:
Protein with the highest isoelectric point:
>tr|Q8AII6|Q8AII6_SIV Protein Vpr OS=Simian immunodeficiency virus SIV-mnd 2 OX=159122 GN=vpr PE=4 SV=1
MM1 pKa = 8.05DD2 pKa = 5.12AGKK5 pKa = 10.27AVSDD9 pKa = 3.85KK10 pKa = 11.35KK11 pKa = 11.06EE12 pKa = 4.19GDD14 pKa = 3.46VTPYY18 pKa = 11.27DD19 pKa = 3.73PFRR22 pKa = 11.84DD23 pKa = 3.36RR24 pKa = 11.84TTPCDD29 pKa = 2.78TCYY32 pKa = 10.66CKK34 pKa = 10.38RR35 pKa = 11.84CCYY38 pKa = 10.1HH39 pKa = 6.59CQLCFLQKK47 pKa = 10.81ALGVHH52 pKa = 4.77YY53 pKa = 10.02HH54 pKa = 7.11AYY56 pKa = 9.32RR57 pKa = 11.84NRR59 pKa = 11.84RR60 pKa = 11.84SRR62 pKa = 11.84QRR64 pKa = 11.84LLEE67 pKa = 4.52KK68 pKa = 10.08ISEE71 pKa = 4.24DD72 pKa = 3.35SRR74 pKa = 11.84VIALFLMSSRR84 pKa = 11.84EE85 pKa = 4.24TISVPTTSNSQAKK98 pKa = 9.58KK99 pKa = 8.96EE100 pKa = 4.35KK101 pKa = 10.37KK102 pKa = 10.47SPTQKK107 pKa = 10.39NRR109 pKa = 11.84VPNQTAPKK117 pKa = 9.87
MM1 pKa = 8.05DD2 pKa = 5.12AGKK5 pKa = 10.27AVSDD9 pKa = 3.85KK10 pKa = 11.35KK11 pKa = 11.06EE12 pKa = 4.19GDD14 pKa = 3.46VTPYY18 pKa = 11.27DD19 pKa = 3.73PFRR22 pKa = 11.84DD23 pKa = 3.36RR24 pKa = 11.84TTPCDD29 pKa = 2.78TCYY32 pKa = 10.66CKK34 pKa = 10.38RR35 pKa = 11.84CCYY38 pKa = 10.1HH39 pKa = 6.59CQLCFLQKK47 pKa = 10.81ALGVHH52 pKa = 4.77YY53 pKa = 10.02HH54 pKa = 7.11AYY56 pKa = 9.32RR57 pKa = 11.84NRR59 pKa = 11.84RR60 pKa = 11.84SRR62 pKa = 11.84QRR64 pKa = 11.84LLEE67 pKa = 4.52KK68 pKa = 10.08ISEE71 pKa = 4.24DD72 pKa = 3.35SRR74 pKa = 11.84VIALFLMSSRR84 pKa = 11.84EE85 pKa = 4.24TISVPTTSNSQAKK98 pKa = 9.58KK99 pKa = 8.96EE100 pKa = 4.35KK101 pKa = 10.37KK102 pKa = 10.47SPTQKK107 pKa = 10.39NRR109 pKa = 11.84VPNQTAPKK117 pKa = 9.87
Molecular weight: 13.46 kDa
Isoelectric point according different methods:
Peptides (in silico digests for buttom-up proteomics)
Below you can find in silico digests of the whole proteome with Trypsin, Chymotrypsin, Trypsin+LysC, LysN, ArgC proteases suitable for different mass spec machines.| Try ESI |
 |
|---|
| ChTry ESI |
|
|---|
| ArgC ESI |
|
|---|
| LysN ESI |
|
|---|
| TryLysC ESI |
|
|---|
| Try MALDI |
|
|---|
| ChTry MALDI |
|
|---|
| ArgC MALDI |
|
|---|
| LysN MALDI |
|
|---|
| TryLysC MALDI |
|
|---|
| Try LTQ |
|
|---|
| ChTry LTQ |
|
|---|
| ArgC LTQ |
|
|---|
| LysN LTQ |
|
|---|
| TryLysC LTQ |
|
|---|
| Try MSlow |
|
|---|
| ChTry MSlow |
|
|---|
| ArgC MSlow |
|
|---|
| LysN MSlow |
|
|---|
| TryLysC MSlow |
|
|---|
| Try MShigh |
|
|---|
| ChTry MShigh |
|
|---|
| ArgC MShigh |
|
|---|
| LysN MShigh |
|
|---|
| TryLysC MShigh |
|
|---|
General Statistics
Number of major isoforms |
Number of additional isoforms |
Number of all proteins |
Number of amino acids |
Min. Seq. Length |
Max. Seq. Length |
Avg. Seq. Length |
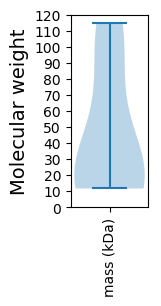
Avg. Mol. Weight |
|---|---|---|---|---|---|---|---|
0 |
3107 |
99 |
1010 |
388.4 |
44.27 |
Amino acid frequency
Ala |
Cys |
Asp |
Glu |
Phe |
Gly |
His |
Ile |
Lys |
Leu |
|---|---|---|---|---|---|---|---|---|---|
5.504 ± 0.346 | 2.446 ± 0.508 |
4.152 ± 0.268 | 7.467 ± 0.777 |
2.671 ± 0.169 | 7.21 ± 0.361 |
2.414 ± 0.451 | 5.729 ± 0.627 |
7.95 ± 0.506 | 8.368 ± 0.365 |
Met |
Asn |
Gln |
Pro |
Arg |
Ser |
Thr |
Val |
Trp |
Tyr |
|---|---|---|---|---|---|---|---|---|---|
2.06 ± 0.498 | 4.248 ± 0.4 |
5.793 ± 0.735 | 5.536 ± 0.375 |
5.053 ± 0.6 | 4.957 ± 0.624 |
6.083 ± 1.053 | 6.019 ± 0.883 |
2.768 ± 0.398 | 3.573 ± 0.498 |
Most of the basic statistics you can see at this page can be downloaded from this CSV file
See this proteome in:

Proteome-pI is available under Creative Commons Attribution-NoDerivs license, for more details see here
| Reference: Kozlowski LP. Proteome-pI 2.0: Proteome Isoelectric Point Database Update. Nucleic Acids Res. 2021, doi: 10.1093/nar/gkab944 | Contact: Lukasz P. Kozlowski |