Lysobacter defluvii IMMIB APB-9 = DSM 18482
Taxonomy: cellular organisms; Bacteria; Proteobacteria; Gammaproteobacteria; Xanthomonadales; Xanthomonadaceae; Lysobacter; Lysobacter defluvii
Average proteome isoelectric point is 6.24
Get precalculated fractions of proteins
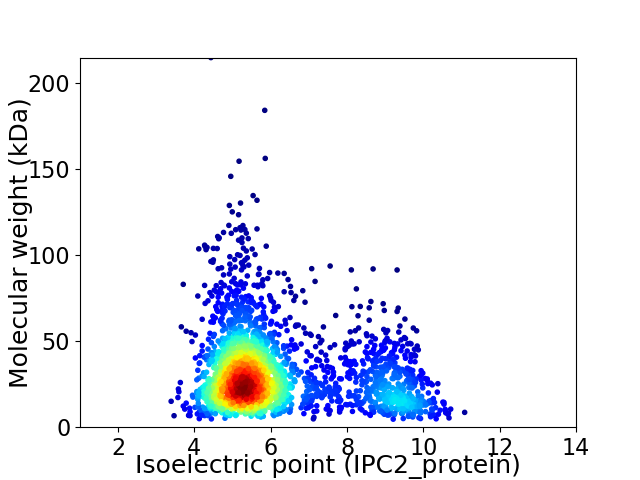
Virtual 2D-PAGE plot for 2443 proteins (isoelectric point calculated using IPC2_protein)
Get csv file with sequences according to given criteria:
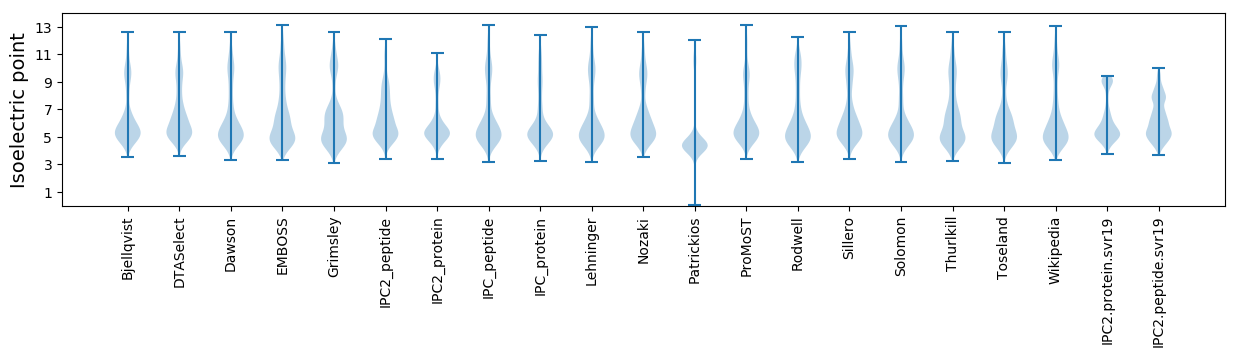
* You can choose from 21 different methods for calculating isoelectric point
Summary statistics related to proteome-wise predictions
Protein with the lowest isoelectric point:
>tr|A0A0A0M3L4|A0A0A0M3L4_9GAMM Nitrogen regulation protein B OS=Lysobacter defluvii IMMIB APB-9 = DSM 18482 OX=1385515 GN=N791_08235 PE=4 SV=1
MM1 pKa = 7.41SKK3 pKa = 10.67DD4 pKa = 3.43ATPLRR9 pKa = 11.84SWMCVVCGFIYY20 pKa = 10.65DD21 pKa = 3.84EE22 pKa = 4.38AAGLPEE28 pKa = 4.46EE29 pKa = 5.49GIAPGTRR36 pKa = 11.84WEE38 pKa = 4.7DD39 pKa = 3.78VPDD42 pKa = 3.14TWTCPDD48 pKa = 4.11CGTTKK53 pKa = 11.08DD54 pKa = 3.91DD55 pKa = 4.23FEE57 pKa = 4.51MVALL61 pKa = 4.43
MM1 pKa = 7.41SKK3 pKa = 10.67DD4 pKa = 3.43ATPLRR9 pKa = 11.84SWMCVVCGFIYY20 pKa = 10.65DD21 pKa = 3.84EE22 pKa = 4.38AAGLPEE28 pKa = 4.46EE29 pKa = 5.49GIAPGTRR36 pKa = 11.84WEE38 pKa = 4.7DD39 pKa = 3.78VPDD42 pKa = 3.14TWTCPDD48 pKa = 4.11CGTTKK53 pKa = 11.08DD54 pKa = 3.91DD55 pKa = 4.23FEE57 pKa = 4.51MVALL61 pKa = 4.43
Molecular weight: 6.73 kDa
Isoelectric point according different methods:
Protein with the highest isoelectric point:
>tr|A0A0A0M392|A0A0A0M392_9GAMM FAD_binding_3 domain-containing protein OS=Lysobacter defluvii IMMIB APB-9 = DSM 18482 OX=1385515 GN=N791_09345 PE=4 SV=1
MM1 pKa = 6.64FTSPKK6 pKa = 9.39RR7 pKa = 11.84YY8 pKa = 8.16GVSSHH13 pKa = 5.52RR14 pKa = 11.84HH15 pKa = 4.41KK16 pKa = 11.04ALNARR21 pKa = 11.84LITAAMPMASKK32 pKa = 9.95MGTSGWARR40 pKa = 11.84RR41 pKa = 11.84QPIWMATATAAPRR54 pKa = 11.84ISKK57 pKa = 9.63PLTSATLALARR68 pKa = 11.84RR69 pKa = 11.84LAPITARR76 pKa = 11.84LSRR79 pKa = 3.9
MM1 pKa = 6.64FTSPKK6 pKa = 9.39RR7 pKa = 11.84YY8 pKa = 8.16GVSSHH13 pKa = 5.52RR14 pKa = 11.84HH15 pKa = 4.41KK16 pKa = 11.04ALNARR21 pKa = 11.84LITAAMPMASKK32 pKa = 9.95MGTSGWARR40 pKa = 11.84RR41 pKa = 11.84QPIWMATATAAPRR54 pKa = 11.84ISKK57 pKa = 9.63PLTSATLALARR68 pKa = 11.84RR69 pKa = 11.84LAPITARR76 pKa = 11.84LSRR79 pKa = 3.9
Molecular weight: 8.62 kDa
Isoelectric point according different methods:
Peptides (in silico digests for buttom-up proteomics)
Below you can find in silico digests of the whole proteome with Trypsin, Chymotrypsin, Trypsin+LysC, LysN, ArgC proteases suitable for different mass spec machines.| Try ESI |
 |
|---|
| ChTry ESI |
|
|---|
| ArgC ESI |
|
|---|
| LysN ESI |
|
|---|
| TryLysC ESI |
|
|---|
| Try MALDI |
|
|---|
| ChTry MALDI |
|
|---|
| ArgC MALDI |
|
|---|
| LysN MALDI |
|
|---|
| TryLysC MALDI |
|
|---|
| Try LTQ |
|
|---|
| ChTry LTQ |
|
|---|
| ArgC LTQ |
|
|---|
| LysN LTQ |
|
|---|
| TryLysC LTQ |
|
|---|
| Try MSlow |
|
|---|
| ChTry MSlow |
|
|---|
| ArgC MSlow |
|
|---|
| LysN MSlow |
|
|---|
| TryLysC MSlow |
|
|---|
| Try MShigh |
|
|---|
| ChTry MShigh |
|
|---|
| ArgC MShigh |
|
|---|
| LysN MShigh |
|
|---|
| TryLysC MShigh |
|
|---|
General Statistics
Number of major isoforms |
Number of additional isoforms |
Number of all proteins |
Number of amino acids |
Min. Seq. Length |
Max. Seq. Length |
Avg. Seq. Length |
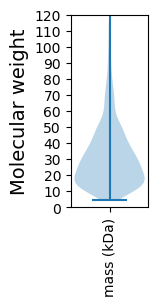
Avg. Mol. Weight |
|---|---|---|---|---|---|---|---|
0 |
739019 |
41 |
1989 |
302.5 |
32.81 |
Amino acid frequency
Ala |
Cys |
Asp |
Glu |
Phe |
Gly |
His |
Ile |
Lys |
Leu |
|---|---|---|---|---|---|---|---|---|---|
12.797 ± 0.062 | 0.758 ± 0.017 |
5.994 ± 0.042 | 6.276 ± 0.052 |
3.241 ± 0.036 | 9.278 ± 0.054 |
2.246 ± 0.028 | 3.8 ± 0.036 |
2.158 ± 0.04 | 10.802 ± 0.069 |
Met |
Asn |
Gln |
Pro |
Arg |
Ser |
Thr |
Val |
Trp |
Tyr |
|---|---|---|---|---|---|---|---|---|---|
2.275 ± 0.023 | 2.231 ± 0.031 |
5.539 ± 0.032 | 3.356 ± 0.032 |
8.161 ± 0.051 | 4.829 ± 0.034 |
4.677 ± 0.032 | 7.89 ± 0.045 |
1.526 ± 0.025 | 2.168 ± 0.023 |
Most of the basic statistics you can see at this page can be downloaded from this CSV file
See this proteome in:

Proteome-pI is available under Creative Commons Attribution-NoDerivs license, for more details see here
| Reference: Kozlowski LP. Proteome-pI 2.0: Proteome Isoelectric Point Database Update. Nucleic Acids Res. 2021, doi: 10.1093/nar/gkab944 | Contact: Lukasz P. Kozlowski |