Melon necrotic spot virus (MNSV)
Taxonomy: Viruses; Riboviria; Orthornavirae; Kitrinoviricota; Tolucaviricetes; Tolivirales; Tombusviridae; Procedovirinae; Gammacarmovirus
Average proteome isoelectric point is 7.64
Get precalculated fractions of proteins
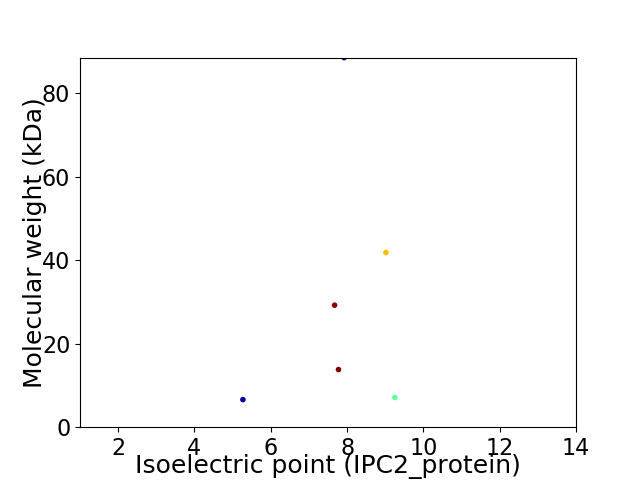
Virtual 2D-PAGE plot for 6 proteins (isoelectric point calculated using IPC2_protein)
Get csv file with sequences according to given criteria:
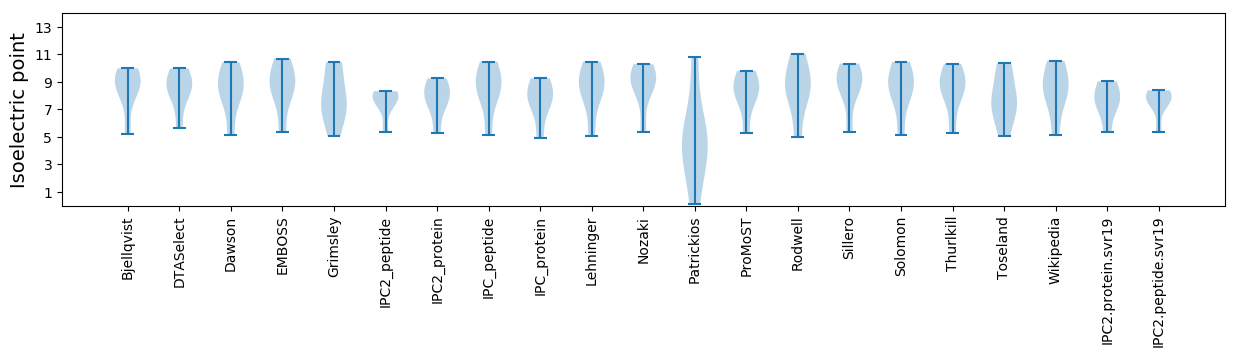
* You can choose from 21 different methods for calculating isoelectric point
Summary statistics related to proteome-wise predictions
Protein with the lowest isoelectric point:
>sp|Q89846|MP2_MNSV Double gene block protein 2 OS=Melon necrotic spot virus OX=11987 GN=ORF3 PE=1 SV=1
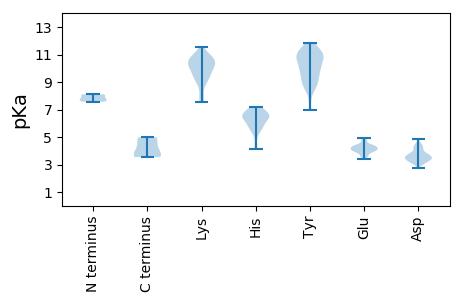
MM1 pKa = 7.57ACCRR5 pKa = 11.84CDD7 pKa = 3.7SSPGDD12 pKa = 3.38YY13 pKa = 10.85SGALLILFISFVFFYY28 pKa = 9.43ITSLSPQGNTYY39 pKa = 8.65VHH41 pKa = 6.79HH42 pKa = 7.17FDD44 pKa = 3.44SSSVKK49 pKa = 7.69TQYY52 pKa = 11.22VGISTNGDD60 pKa = 3.11GG61 pKa = 4.98
MM1 pKa = 7.57ACCRR5 pKa = 11.84CDD7 pKa = 3.7SSPGDD12 pKa = 3.38YY13 pKa = 10.85SGALLILFISFVFFYY28 pKa = 9.43ITSLSPQGNTYY39 pKa = 8.65VHH41 pKa = 6.79HH42 pKa = 7.17FDD44 pKa = 3.44SSSVKK49 pKa = 7.69TQYY52 pKa = 11.22VGISTNGDD60 pKa = 3.11GG61 pKa = 4.98
Molecular weight: 6.61 kDa
Isoelectric point according different methods:
Protein with the highest isoelectric point:
>sp|Q89846|MP2_MNSV Double gene block protein 2 OS=Melon necrotic spot virus OX=11987 GN=ORF3 PE=1 SV=1
MM1 pKa = 8.11DD2 pKa = 3.57SQRR5 pKa = 11.84TVEE8 pKa = 4.04LTNPRR13 pKa = 11.84GRR15 pKa = 11.84SKK17 pKa = 10.99EE18 pKa = 3.97RR19 pKa = 11.84GDD21 pKa = 4.34SGGKK25 pKa = 8.97QKK27 pKa = 11.39NSMGRR32 pKa = 11.84KK33 pKa = 7.57IANDD37 pKa = 4.35AISEE41 pKa = 4.31SKK43 pKa = 10.1QGVMGASTYY52 pKa = 10.45IADD55 pKa = 4.54KK56 pKa = 10.83IKK58 pKa = 10.11VTINFNFF65 pKa = 3.54
MM1 pKa = 8.11DD2 pKa = 3.57SQRR5 pKa = 11.84TVEE8 pKa = 4.04LTNPRR13 pKa = 11.84GRR15 pKa = 11.84SKK17 pKa = 10.99EE18 pKa = 3.97RR19 pKa = 11.84GDD21 pKa = 4.34SGGKK25 pKa = 8.97QKK27 pKa = 11.39NSMGRR32 pKa = 11.84KK33 pKa = 7.57IANDD37 pKa = 4.35AISEE41 pKa = 4.31SKK43 pKa = 10.1QGVMGASTYY52 pKa = 10.45IADD55 pKa = 4.54KK56 pKa = 10.83IKK58 pKa = 10.11VTINFNFF65 pKa = 3.54
Molecular weight: 7.12 kDa
Isoelectric point according different methods:
Peptides (in silico digests for buttom-up proteomics)
Below you can find in silico digests of the whole proteome with Trypsin, Chymotrypsin, Trypsin+LysC, LysN, ArgC proteases suitable for different mass spec machines.| Try ESI |
 |
|---|
| ChTry ESI |
|
|---|
| ArgC ESI |
|
|---|
| LysN ESI |
|
|---|
| TryLysC ESI |
|
|---|
| Try MALDI |
|
|---|
| ChTry MALDI |
|
|---|
| ArgC MALDI |
|
|---|
| LysN MALDI |
|
|---|
| TryLysC MALDI |
|
|---|
| Try LTQ |
|
|---|
| ChTry LTQ |
|
|---|
| ArgC LTQ |
|
|---|
| LysN LTQ |
|
|---|
| TryLysC LTQ |
|
|---|
| Try MSlow |
|
|---|
| ChTry MSlow |
|
|---|
| ArgC MSlow |
|
|---|
| LysN MSlow |
|
|---|
| TryLysC MSlow |
|
|---|
| Try MShigh |
|
|---|
| ChTry MShigh |
|
|---|
| ArgC MShigh |
|
|---|
| LysN MShigh |
|
|---|
| TryLysC MShigh |
|
|---|
General Statistics
Number of major isoforms |
Number of additional isoforms |
Number of all proteins |
Number of amino acids |
Min. Seq. Length |
Max. Seq. Length |
Avg. Seq. Length |
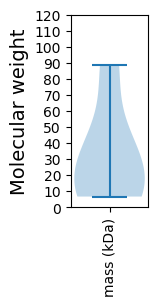
Avg. Mol. Weight |
|---|---|---|---|---|---|---|---|
0 |
1703 |
61 |
791 |
283.8 |
31.2 |
Amino acid frequency
Ala |
Cys |
Asp |
Glu |
Phe |
Gly |
His |
Ile |
Lys |
Leu |
|---|---|---|---|---|---|---|---|---|---|
6.87 ± 0.708 | 2.231 ± 0.451 |
5.461 ± 0.23 | 4.052 ± 0.818 |
3.699 ± 0.56 | 7.927 ± 0.514 |
2.173 ± 0.466 | 6.87 ± 0.539 |
5.461 ± 0.608 | 7.692 ± 0.897 |
Met |
Asn |
Gln |
Pro |
Arg |
Ser |
Thr |
Val |
Trp |
Tyr |
|---|---|---|---|---|---|---|---|---|---|
2.173 ± 0.267 | 4.991 ± 0.472 |
3.934 ± 0.467 | 2.466 ± 0.359 |
6.107 ± 0.649 | 9.571 ± 1.147 |
5.637 ± 0.754 | 8.103 ± 0.693 |
1.409 ± 0.364 | 3.053 ± 0.413 |
Most of the basic statistics you can see at this page can be downloaded from this CSV file
See this proteome in:

Proteome-pI is available under Creative Commons Attribution-NoDerivs license, for more details see here
| Reference: Kozlowski LP. Proteome-pI 2.0: Proteome Isoelectric Point Database Update. Nucleic Acids Res. 2021, doi: 10.1093/nar/gkab944 | Contact: Lukasz P. Kozlowski |