Planctomycetes bacterium SV_7m_r
Taxonomy: cellular organisms; Bacteria; PVC group; Planctomycetes; unclassified Planctomycetes
Average proteome isoelectric point is 6.28
Get precalculated fractions of proteins
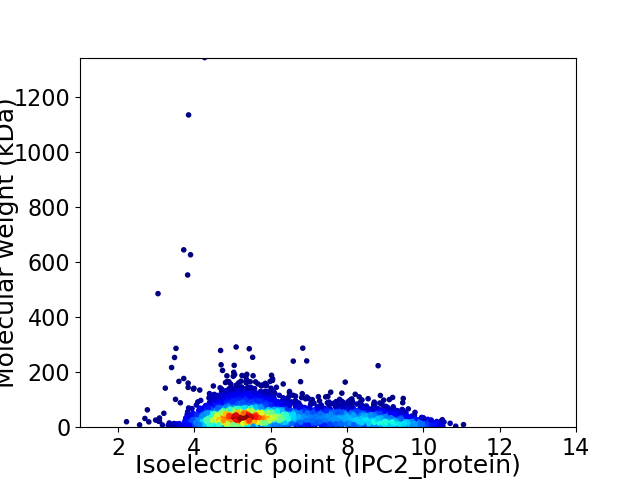
Virtual 2D-PAGE plot for 5245 proteins (isoelectric point calculated using IPC2_protein)
Get csv file with sequences according to given criteria:
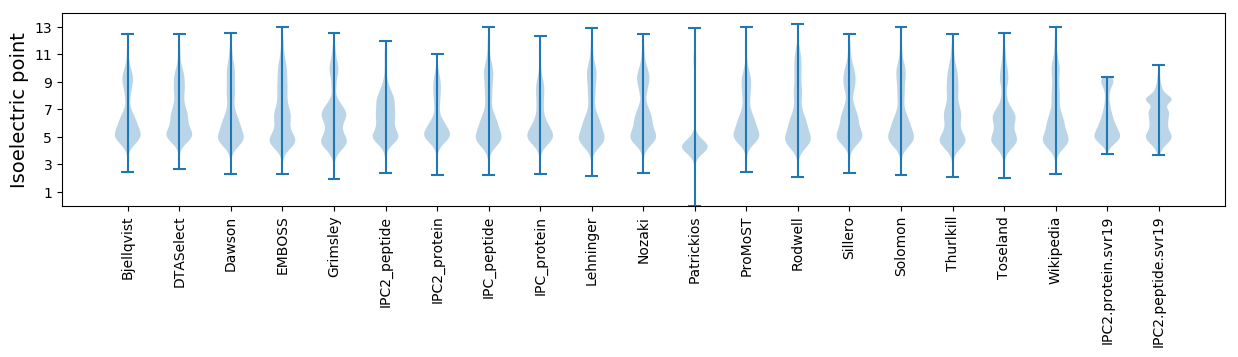
* You can choose from 21 different methods for calculating isoelectric point
Summary statistics related to proteome-wise predictions
Protein with the lowest isoelectric point:
>tr|A0A517SXU4|A0A517SXU4_9BACT Phage-related baseplate assembly protein OS=Planctomycetes bacterium SV_7m_r OX=2528025 GN=SV7mr_34020 PE=3 SV=1
MM1 pKa = 7.2SVLYY5 pKa = 9.93IALPIAILLGAGGLIACLYY24 pKa = 9.35CIKK27 pKa = 10.64DD28 pKa = 3.55GQYY31 pKa = 11.46DD32 pKa = 3.94DD33 pKa = 5.7LDD35 pKa = 4.29SPSVRR40 pKa = 11.84MLIDD44 pKa = 4.25DD45 pKa = 4.67EE46 pKa = 4.67PVQQAAEE53 pKa = 4.11SDD55 pKa = 3.73ADD57 pKa = 3.4AHH59 pKa = 5.35EE60 pKa = 4.72AKK62 pKa = 10.61LL63 pKa = 3.66
MM1 pKa = 7.2SVLYY5 pKa = 9.93IALPIAILLGAGGLIACLYY24 pKa = 9.35CIKK27 pKa = 10.64DD28 pKa = 3.55GQYY31 pKa = 11.46DD32 pKa = 3.94DD33 pKa = 5.7LDD35 pKa = 4.29SPSVRR40 pKa = 11.84MLIDD44 pKa = 4.25DD45 pKa = 4.67EE46 pKa = 4.67PVQQAAEE53 pKa = 4.11SDD55 pKa = 3.73ADD57 pKa = 3.4AHH59 pKa = 5.35EE60 pKa = 4.72AKK62 pKa = 10.61LL63 pKa = 3.66
Molecular weight: 6.72 kDa
Isoelectric point according different methods:
Protein with the highest isoelectric point:
>tr|A0A517SNK8|A0A517SNK8_9BACT Methionine--tRNA ligase OS=Planctomycetes bacterium SV_7m_r OX=2528025 GN=metG PE=3 SV=1
MM1 pKa = 7.91AKK3 pKa = 9.65PQHH6 pKa = 6.16KK7 pKa = 9.83LKK9 pKa = 10.41KK10 pKa = 8.54ANHH13 pKa = 5.37GRR15 pKa = 11.84RR16 pKa = 11.84PASAKK21 pKa = 9.66ARR23 pKa = 11.84KK24 pKa = 9.25AKK26 pKa = 9.98RR27 pKa = 11.84KK28 pKa = 9.47KK29 pKa = 10.27IKK31 pKa = 9.22TT32 pKa = 3.56
MM1 pKa = 7.91AKK3 pKa = 9.65PQHH6 pKa = 6.16KK7 pKa = 9.83LKK9 pKa = 10.41KK10 pKa = 8.54ANHH13 pKa = 5.37GRR15 pKa = 11.84RR16 pKa = 11.84PASAKK21 pKa = 9.66ARR23 pKa = 11.84KK24 pKa = 9.25AKK26 pKa = 9.98RR27 pKa = 11.84KK28 pKa = 9.47KK29 pKa = 10.27IKK31 pKa = 9.22TT32 pKa = 3.56
Molecular weight: 3.66 kDa
Isoelectric point according different methods:
Peptides (in silico digests for buttom-up proteomics)
Below you can find in silico digests of the whole proteome with Trypsin, Chymotrypsin, Trypsin+LysC, LysN, ArgC proteases suitable for different mass spec machines.| Try ESI |
 |
|---|
| ChTry ESI |
|
|---|
| ArgC ESI |
|
|---|
| LysN ESI |
|
|---|
| TryLysC ESI |
|
|---|
| Try MALDI |
|
|---|
| ChTry MALDI |
|
|---|
| ArgC MALDI |
|
|---|
| LysN MALDI |
|
|---|
| TryLysC MALDI |
|
|---|
| Try LTQ |
|
|---|
| ChTry LTQ |
|
|---|
| ArgC LTQ |
|
|---|
| LysN LTQ |
|
|---|
| TryLysC LTQ |
|
|---|
| Try MSlow |
|
|---|
| ChTry MSlow |
|
|---|
| ArgC MSlow |
|
|---|
| LysN MSlow |
|
|---|
| TryLysC MSlow |
|
|---|
| Try MShigh |
|
|---|
| ChTry MShigh |
|
|---|
| ArgC MShigh |
|
|---|
| LysN MShigh |
|
|---|
| TryLysC MShigh |
|
|---|
General Statistics
Number of major isoforms |
Number of additional isoforms |
Number of all proteins |
Number of amino acids |
Min. Seq. Length |
Max. Seq. Length |
Avg. Seq. Length |
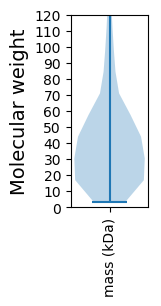
Avg. Mol. Weight |
|---|---|---|---|---|---|---|---|
0 |
2028258 |
29 |
12437 |
386.7 |
42.55 |
Amino acid frequency
Ala |
Cys |
Asp |
Glu |
Phe |
Gly |
His |
Ile |
Lys |
Leu |
|---|---|---|---|---|---|---|---|---|---|
9.671 ± 0.032 | 1.161 ± 0.017 |
6.283 ± 0.042 | 5.678 ± 0.034 |
3.574 ± 0.02 | 7.506 ± 0.048 |
2.25 ± 0.019 | 4.941 ± 0.022 |
3.803 ± 0.038 | 9.74 ± 0.034 |
Met |
Asn |
Gln |
Pro |
Arg |
Ser |
Thr |
Val |
Trp |
Tyr |
|---|---|---|---|---|---|---|---|---|---|
2.265 ± 0.021 | 3.368 ± 0.028 |
5.313 ± 0.03 | 5.139 ± 0.038 |
6.286 ± 0.038 | 6.764 ± 0.031 |
5.543 ± 0.038 | 6.939 ± 0.03 |
1.446 ± 0.017 | 2.328 ± 0.017 |
Most of the basic statistics you can see at this page can be downloaded from this CSV file
See this proteome in:

Proteome-pI is available under Creative Commons Attribution-NoDerivs license, for more details see here
| Reference: Kozlowski LP. Proteome-pI 2.0: Proteome Isoelectric Point Database Update. Nucleic Acids Res. 2021, doi: 10.1093/nar/gkab944 | Contact: Lukasz P. Kozlowski |