Richelia intracellularis HM01
Taxonomy: cellular organisms; Bacteria; Terrabacteria group; Cyanobacteria/Melainabacteria group; Cyanobacteria; Nostocales; Nostocaceae; Richelia; Richelia intracellularis
Average proteome isoelectric point is 6.79
Get precalculated fractions of proteins
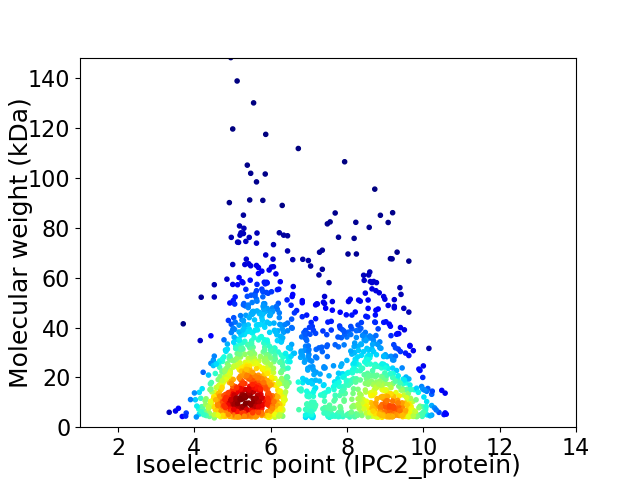
Virtual 2D-PAGE plot for 1674 proteins (isoelectric point calculated using IPC2_protein)
Get csv file with sequences according to given criteria:
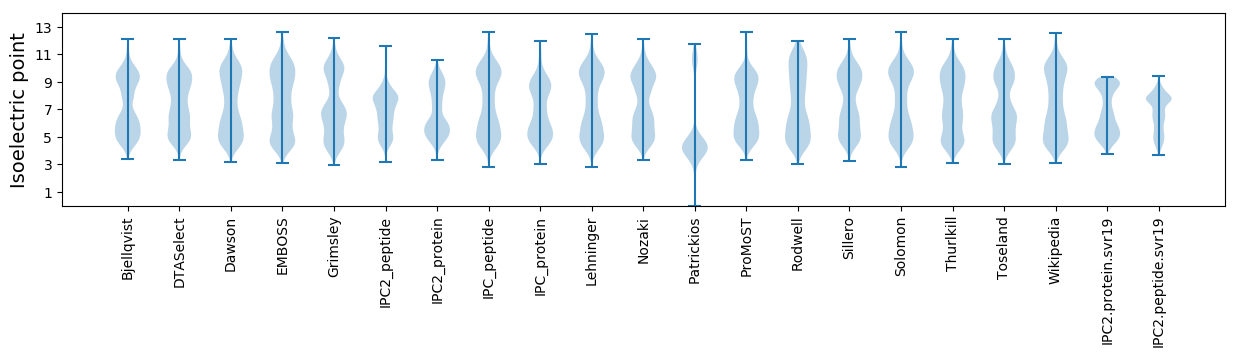
* You can choose from 21 different methods for calculating isoelectric point
Summary statistics related to proteome-wise predictions
Protein with the lowest isoelectric point:
>tr|M1WVD8|M1WVD8_9NOST Heterocyst-specific glycolipids-directing protein OS=Richelia intracellularis HM01 OX=1165095 GN=RINTHM_5760 PE=4 SV=1
MM1 pKa = 7.8DD2 pKa = 4.6TLGMLIGLDD11 pKa = 3.42VQSQYY16 pKa = 11.64EE17 pKa = 4.12DD18 pKa = 3.44AQAHH22 pKa = 6.46LEE24 pKa = 4.27PGDD27 pKa = 3.72TIIYY31 pKa = 7.75YY32 pKa = 10.03TDD34 pKa = 3.45GLTDD38 pKa = 3.78AAAADD43 pKa = 3.89GNRR46 pKa = 11.84FDD48 pKa = 4.16EE49 pKa = 4.74EE50 pKa = 4.11NLISHH55 pKa = 7.28LSFACRR61 pKa = 11.84YY62 pKa = 9.19CSSTQEE68 pKa = 3.78ILDD71 pKa = 3.72YY72 pKa = 11.44LFDD75 pKa = 3.8QVQKK79 pKa = 10.96FIGANKK85 pKa = 9.73QSNDD89 pKa = 3.17DD90 pKa = 3.49MTLVVLQVRR99 pKa = 4.4
MM1 pKa = 7.8DD2 pKa = 4.6TLGMLIGLDD11 pKa = 3.42VQSQYY16 pKa = 11.64EE17 pKa = 4.12DD18 pKa = 3.44AQAHH22 pKa = 6.46LEE24 pKa = 4.27PGDD27 pKa = 3.72TIIYY31 pKa = 7.75YY32 pKa = 10.03TDD34 pKa = 3.45GLTDD38 pKa = 3.78AAAADD43 pKa = 3.89GNRR46 pKa = 11.84FDD48 pKa = 4.16EE49 pKa = 4.74EE50 pKa = 4.11NLISHH55 pKa = 7.28LSFACRR61 pKa = 11.84YY62 pKa = 9.19CSSTQEE68 pKa = 3.78ILDD71 pKa = 3.72YY72 pKa = 11.44LFDD75 pKa = 3.8QVQKK79 pKa = 10.96FIGANKK85 pKa = 9.73QSNDD89 pKa = 3.17DD90 pKa = 3.49MTLVVLQVRR99 pKa = 4.4
Molecular weight: 11.09 kDa
Isoelectric point according different methods:
Protein with the highest isoelectric point:
>tr|M1WV27|M1WV27_9NOST Uncharacterized protein OS=Richelia intracellularis HM01 OX=1165095 GN=RINTHM_2460 PE=4 SV=1
MM1 pKa = 7.17SRR3 pKa = 11.84YY4 pKa = 9.52RR5 pKa = 11.84GPRR8 pKa = 11.84LRR10 pKa = 11.84ITRR13 pKa = 11.84RR14 pKa = 11.84LGEE17 pKa = 4.22LPGLTRR23 pKa = 11.84KK24 pKa = 9.04SARR27 pKa = 11.84RR28 pKa = 11.84AYY30 pKa = 9.88PPGQHH35 pKa = 5.24GQNRR39 pKa = 11.84KK40 pKa = 9.27KK41 pKa = 10.18RR42 pKa = 11.84SEE44 pKa = 3.92YY45 pKa = 10.72AVRR48 pKa = 11.84LEE50 pKa = 4.23EE51 pKa = 4.12KK52 pKa = 10.23QKK54 pKa = 11.1LRR56 pKa = 11.84FNYY59 pKa = 9.88GLSEE63 pKa = 4.22SQLLRR68 pKa = 11.84YY69 pKa = 8.64IRR71 pKa = 11.84KK72 pKa = 8.69ARR74 pKa = 11.84RR75 pKa = 11.84VTGSTGQVLLQLLEE89 pKa = 4.0MRR91 pKa = 11.84LDD93 pKa = 3.36NTTFRR98 pKa = 11.84LGLAPTIPAARR109 pKa = 11.84QLVNHH114 pKa = 5.97GHH116 pKa = 5.63ITVNSKK122 pKa = 9.49VVNIASYY129 pKa = 8.06QCRR132 pKa = 11.84PGEE135 pKa = 4.25VISIINRR142 pKa = 11.84DD143 pKa = 3.35KK144 pKa = 10.79SRR146 pKa = 11.84QMVEE150 pKa = 3.96TNLQYY155 pKa = 10.64PGLANLPSHH164 pKa = 7.36LEE166 pKa = 3.61FDD168 pKa = 3.84KK169 pKa = 11.6NKK171 pKa = 10.83LEE173 pKa = 4.16GKK175 pKa = 9.11INSVIEE181 pKa = 4.25RR182 pKa = 11.84EE183 pKa = 4.3WVALQINEE191 pKa = 4.28LLVVEE196 pKa = 5.04YY197 pKa = 9.28YY198 pKa = 11.26SRR200 pKa = 11.84MAA202 pKa = 4.45
MM1 pKa = 7.17SRR3 pKa = 11.84YY4 pKa = 9.52RR5 pKa = 11.84GPRR8 pKa = 11.84LRR10 pKa = 11.84ITRR13 pKa = 11.84RR14 pKa = 11.84LGEE17 pKa = 4.22LPGLTRR23 pKa = 11.84KK24 pKa = 9.04SARR27 pKa = 11.84RR28 pKa = 11.84AYY30 pKa = 9.88PPGQHH35 pKa = 5.24GQNRR39 pKa = 11.84KK40 pKa = 9.27KK41 pKa = 10.18RR42 pKa = 11.84SEE44 pKa = 3.92YY45 pKa = 10.72AVRR48 pKa = 11.84LEE50 pKa = 4.23EE51 pKa = 4.12KK52 pKa = 10.23QKK54 pKa = 11.1LRR56 pKa = 11.84FNYY59 pKa = 9.88GLSEE63 pKa = 4.22SQLLRR68 pKa = 11.84YY69 pKa = 8.64IRR71 pKa = 11.84KK72 pKa = 8.69ARR74 pKa = 11.84RR75 pKa = 11.84VTGSTGQVLLQLLEE89 pKa = 4.0MRR91 pKa = 11.84LDD93 pKa = 3.36NTTFRR98 pKa = 11.84LGLAPTIPAARR109 pKa = 11.84QLVNHH114 pKa = 5.97GHH116 pKa = 5.63ITVNSKK122 pKa = 9.49VVNIASYY129 pKa = 8.06QCRR132 pKa = 11.84PGEE135 pKa = 4.25VISIINRR142 pKa = 11.84DD143 pKa = 3.35KK144 pKa = 10.79SRR146 pKa = 11.84QMVEE150 pKa = 3.96TNLQYY155 pKa = 10.64PGLANLPSHH164 pKa = 7.36LEE166 pKa = 3.61FDD168 pKa = 3.84KK169 pKa = 11.6NKK171 pKa = 10.83LEE173 pKa = 4.16GKK175 pKa = 9.11INSVIEE181 pKa = 4.25RR182 pKa = 11.84EE183 pKa = 4.3WVALQINEE191 pKa = 4.28LLVVEE196 pKa = 5.04YY197 pKa = 9.28YY198 pKa = 11.26SRR200 pKa = 11.84MAA202 pKa = 4.45
Molecular weight: 23.34 kDa
Isoelectric point according different methods:
Peptides (in silico digests for buttom-up proteomics)
Below you can find in silico digests of the whole proteome with Trypsin, Chymotrypsin, Trypsin+LysC, LysN, ArgC proteases suitable for different mass spec machines.| Try ESI |
 |
|---|
| ChTry ESI |
|
|---|
| ArgC ESI |
|
|---|
| LysN ESI |
|
|---|
| TryLysC ESI |
|
|---|
| Try MALDI |
|
|---|
| ChTry MALDI |
|
|---|
| ArgC MALDI |
|
|---|
| LysN MALDI |
|
|---|
| TryLysC MALDI |
|
|---|
| Try LTQ |
|
|---|
| ChTry LTQ |
|
|---|
| ArgC LTQ |
|
|---|
| LysN LTQ |
|
|---|
| TryLysC LTQ |
|
|---|
| Try MSlow |
|
|---|
| ChTry MSlow |
|
|---|
| ArgC MSlow |
|
|---|
| LysN MSlow |
|
|---|
| TryLysC MSlow |
|
|---|
| Try MShigh |
|
|---|
| ChTry MShigh |
|
|---|
| ArgC MShigh |
|
|---|
| LysN MShigh |
|
|---|
| TryLysC MShigh |
|
|---|
General Statistics
Number of major isoforms |
Number of additional isoforms |
Number of all proteins |
Number of amino acids |
Min. Seq. Length |
Max. Seq. Length |
Avg. Seq. Length |
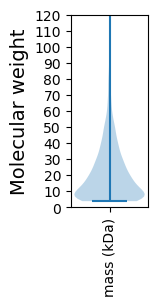
Avg. Mol. Weight |
|---|---|---|---|---|---|---|---|
0 |
329974 |
37 |
1318 |
197.1 |
22.09 |
Amino acid frequency
Ala |
Cys |
Asp |
Glu |
Phe |
Gly |
His |
Ile |
Lys |
Leu |
|---|---|---|---|---|---|---|---|---|---|
7.018 ± 0.07 | 1.198 ± 0.024 |
4.498 ± 0.051 | 5.968 ± 0.066 |
3.866 ± 0.055 | 6.659 ± 0.067 |
2.043 ± 0.033 | 8.174 ± 0.062 |
5.619 ± 0.056 | 10.932 ± 0.082 |
Met |
Asn |
Gln |
Pro |
Arg |
Ser |
Thr |
Val |
Trp |
Tyr |
|---|---|---|---|---|---|---|---|---|---|
2.302 ± 0.03 | 4.862 ± 0.056 |
4.249 ± 0.036 | 4.831 ± 0.059 |
4.779 ± 0.05 | 6.578 ± 0.054 |
5.353 ± 0.042 | 6.393 ± 0.044 |
1.344 ± 0.03 | 3.333 ± 0.035 |
Most of the basic statistics you can see at this page can be downloaded from this CSV file
See this proteome in:

Proteome-pI is available under Creative Commons Attribution-NoDerivs license, for more details see here
| Reference: Kozlowski LP. Proteome-pI 2.0: Proteome Isoelectric Point Database Update. Nucleic Acids Res. 2021, doi: 10.1093/nar/gkab944 | Contact: Lukasz P. Kozlowski |