Actinomyces bovis
Taxonomy: cellular organisms; Bacteria; Terrabacteria group; Actinobacteria; Actinomycetia; Actinomycetales; Actinomycetaceae; Actinomyces
Average proteome isoelectric point is 6.34
Get precalculated fractions of proteins
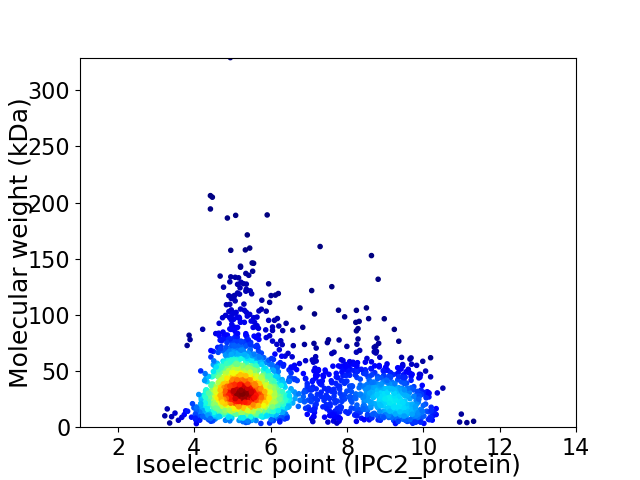
Virtual 2D-PAGE plot for 2148 proteins (isoelectric point calculated using IPC2_protein)
Get csv file with sequences according to given criteria:
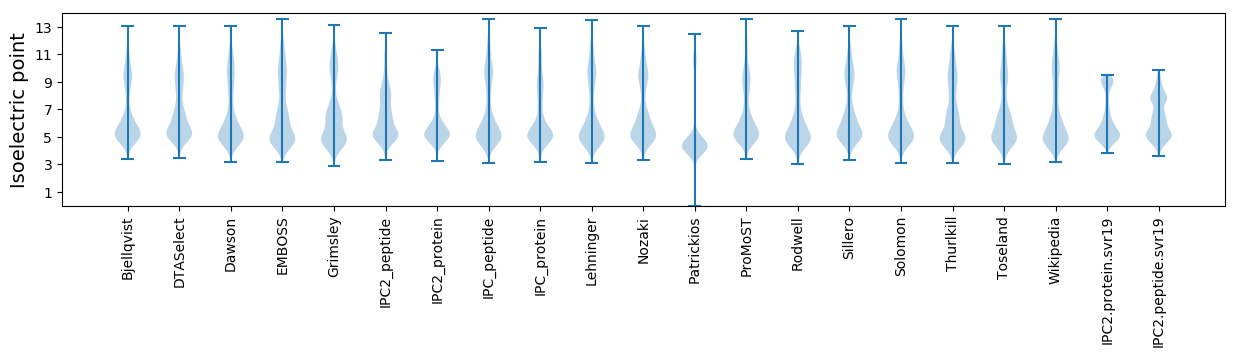
* You can choose from 21 different methods for calculating isoelectric point
Summary statistics related to proteome-wise predictions
Protein with the lowest isoelectric point:
>tr|A0A2X0UBI8|A0A2X0UBI8_9ACTO Hypoxanthine phosphoribosyltransferase OS=Actinomyces bovis OX=1658 GN=hpt PE=3 SV=1
MM1 pKa = 6.47TQYY4 pKa = 10.81EE5 pKa = 4.48AGLMVEE11 pKa = 5.29DD12 pKa = 3.83ISVAKK17 pKa = 10.3FLLPTTLPEE26 pKa = 3.93TWTGSAATACANALTQASKK45 pKa = 11.16LLDD48 pKa = 3.47QVTLSGGQASNSCLALDD65 pKa = 4.04QVII68 pKa = 3.91
MM1 pKa = 6.47TQYY4 pKa = 10.81EE5 pKa = 4.48AGLMVEE11 pKa = 5.29DD12 pKa = 3.83ISVAKK17 pKa = 10.3FLLPTTLPEE26 pKa = 3.93TWTGSAATACANALTQASKK45 pKa = 11.16LLDD48 pKa = 3.47QVTLSGGQASNSCLALDD65 pKa = 4.04QVII68 pKa = 3.91
Molecular weight: 7.06 kDa
Isoelectric point according different methods:
Protein with the highest isoelectric point:
>tr|A0A2X0UFL7|A0A2X0UFL7_9ACTO Uncharacterized protein OS=Actinomyces bovis OX=1658 GN=NCTC11535_02137 PE=4 SV=1
MM1 pKa = 7.69SKK3 pKa = 9.0RR4 pKa = 11.84TFQPNNRR11 pKa = 11.84RR12 pKa = 11.84RR13 pKa = 11.84AKK15 pKa = 9.4VHH17 pKa = 5.52GFRR20 pKa = 11.84KK21 pKa = 9.84RR22 pKa = 11.84MSSRR26 pKa = 11.84AGRR29 pKa = 11.84AVLASRR35 pKa = 11.84RR36 pKa = 11.84RR37 pKa = 11.84KK38 pKa = 9.61GRR40 pKa = 11.84ARR42 pKa = 11.84LAAA45 pKa = 4.44
MM1 pKa = 7.69SKK3 pKa = 9.0RR4 pKa = 11.84TFQPNNRR11 pKa = 11.84RR12 pKa = 11.84RR13 pKa = 11.84AKK15 pKa = 9.4VHH17 pKa = 5.52GFRR20 pKa = 11.84KK21 pKa = 9.84RR22 pKa = 11.84MSSRR26 pKa = 11.84AGRR29 pKa = 11.84AVLASRR35 pKa = 11.84RR36 pKa = 11.84RR37 pKa = 11.84KK38 pKa = 9.61GRR40 pKa = 11.84ARR42 pKa = 11.84LAAA45 pKa = 4.44
Molecular weight: 5.25 kDa
Isoelectric point according different methods:
Peptides (in silico digests for buttom-up proteomics)
Below you can find in silico digests of the whole proteome with Trypsin, Chymotrypsin, Trypsin+LysC, LysN, ArgC proteases suitable for different mass spec machines.| Try ESI |
 |
|---|
| ChTry ESI |
|
|---|
| ArgC ESI |
|
|---|
| LysN ESI |
|
|---|
| TryLysC ESI |
|
|---|
| Try MALDI |
|
|---|
| ChTry MALDI |
|
|---|
| ArgC MALDI |
|
|---|
| LysN MALDI |
|
|---|
| TryLysC MALDI |
|
|---|
| Try LTQ |
|
|---|
| ChTry LTQ |
|
|---|
| ArgC LTQ |
|
|---|
| LysN LTQ |
|
|---|
| TryLysC LTQ |
|
|---|
| Try MSlow |
|
|---|
| ChTry MSlow |
|
|---|
| ArgC MSlow |
|
|---|
| LysN MSlow |
|
|---|
| TryLysC MSlow |
|
|---|
| Try MShigh |
|
|---|
| ChTry MShigh |
|
|---|
| ArgC MShigh |
|
|---|
| LysN MShigh |
|
|---|
| TryLysC MShigh |
|
|---|
General Statistics
Number of major isoforms |
Number of additional isoforms |
Number of all proteins |
Number of amino acids |
Min. Seq. Length |
Max. Seq. Length |
Avg. Seq. Length |
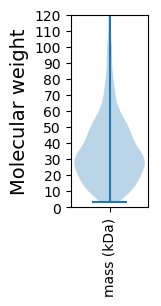
Avg. Mol. Weight |
|---|---|---|---|---|---|---|---|
0 |
763328 |
29 |
3149 |
355.4 |
37.94 |
Amino acid frequency
Ala |
Cys |
Asp |
Glu |
Phe |
Gly |
His |
Ile |
Lys |
Leu |
|---|---|---|---|---|---|---|---|---|---|
13.499 ± 0.088 | 0.827 ± 0.014 |
5.299 ± 0.042 | 5.82 ± 0.056 |
2.516 ± 0.032 | 8.712 ± 0.047 |
1.979 ± 0.018 | 3.658 ± 0.051 |
2.702 ± 0.048 | 10.491 ± 0.078 |
Met |
Asn |
Gln |
Pro |
Arg |
Ser |
Thr |
Val |
Trp |
Tyr |
|---|---|---|---|---|---|---|---|---|---|
1.893 ± 0.023 | 2.175 ± 0.029 |
5.731 ± 0.047 | 3.622 ± 0.03 |
6.799 ± 0.055 | 6.019 ± 0.047 |
6.284 ± 0.055 | 8.551 ± 0.05 |
1.489 ± 0.023 | 1.934 ± 0.029 |
Most of the basic statistics you can see at this page can be downloaded from this CSV file
See this proteome in:

Proteome-pI is available under Creative Commons Attribution-NoDerivs license, for more details see here
| Reference: Kozlowski LP. Proteome-pI 2.0: Proteome Isoelectric Point Database Update. Nucleic Acids Res. 2021, doi: 10.1093/nar/gkab944 | Contact: Lukasz P. Kozlowski |