Clostridium sp. CAG:306
Taxonomy: cellular organisms; Bacteria; Terrabacteria group; Firmicutes; Clostridia; Eubacteriales; Clostridiaceae; Clostridium; environmental samples
Average proteome isoelectric point is 6.73
Get precalculated fractions of proteins
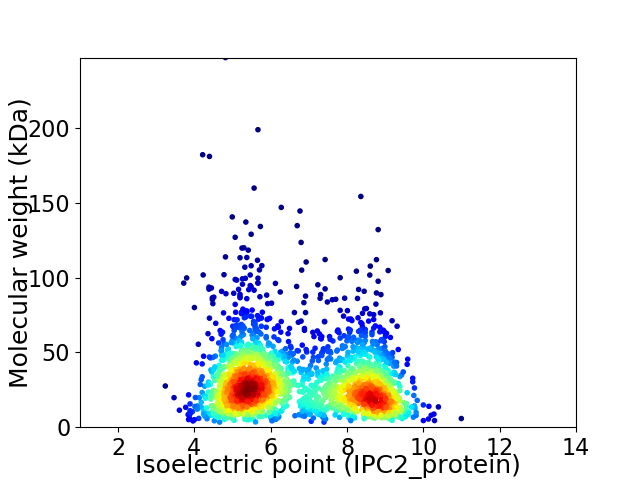
Virtual 2D-PAGE plot for 2130 proteins (isoelectric point calculated using IPC2_protein)
Get csv file with sequences according to given criteria:
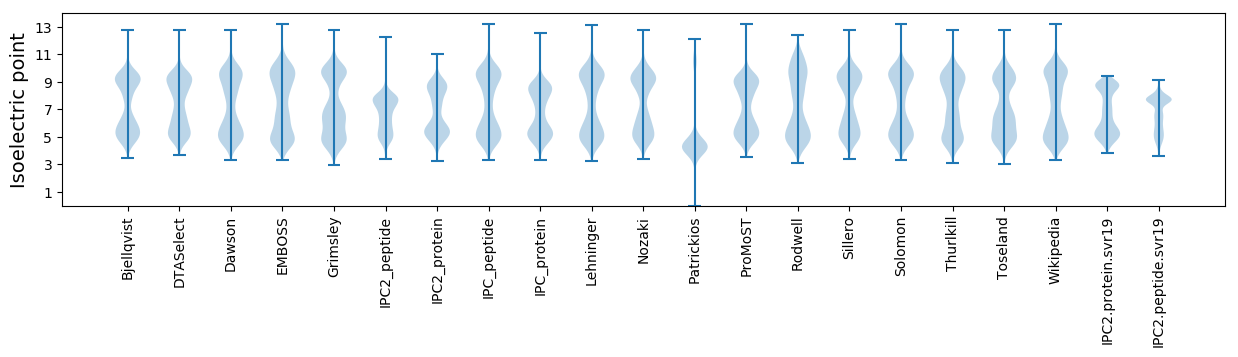
* You can choose from 21 different methods for calculating isoelectric point
Summary statistics related to proteome-wise predictions
Protein with the lowest isoelectric point:
>tr|R6P7D6|R6P7D6_9CLOT Uncharacterized protein OS=Clostridium sp. CAG:306 OX=1262794 GN=BN597_01902 PE=4 SV=1
MM1 pKa = 7.35NLNEE5 pKa = 4.18EE6 pKa = 4.52CLLKK10 pKa = 10.83YY11 pKa = 10.0LQNPDD16 pKa = 3.67EE17 pKa = 4.96LVDD20 pKa = 3.94LTSLLLEE27 pKa = 4.45FNNDD31 pKa = 3.19YY32 pKa = 11.06EE33 pKa = 4.77KK34 pKa = 11.49NN35 pKa = 3.59
MM1 pKa = 7.35NLNEE5 pKa = 4.18EE6 pKa = 4.52CLLKK10 pKa = 10.83YY11 pKa = 10.0LQNPDD16 pKa = 3.67EE17 pKa = 4.96LVDD20 pKa = 3.94LTSLLLEE27 pKa = 4.45FNNDD31 pKa = 3.19YY32 pKa = 11.06EE33 pKa = 4.77KK34 pKa = 11.49NN35 pKa = 3.59
Molecular weight: 4.19 kDa
Isoelectric point according different methods:
Protein with the highest isoelectric point:
>tr|R6PBQ8|R6PBQ8_9CLOT Uncharacterized protein OS=Clostridium sp. CAG:306 OX=1262794 GN=BN597_00526 PE=4 SV=1
MM1 pKa = 7.68RR2 pKa = 11.84RR3 pKa = 11.84TLEE6 pKa = 3.61GTKK9 pKa = 9.97RR10 pKa = 11.84KK11 pKa = 8.92RR12 pKa = 11.84QNVSGFRR19 pKa = 11.84ARR21 pKa = 11.84MATPGGRR28 pKa = 11.84TVLNRR33 pKa = 11.84RR34 pKa = 11.84RR35 pKa = 11.84AKK37 pKa = 10.06GRR39 pKa = 11.84HH40 pKa = 5.15RR41 pKa = 11.84LAIQAKK47 pKa = 9.31KK48 pKa = 10.18RR49 pKa = 11.84AA50 pKa = 3.68
MM1 pKa = 7.68RR2 pKa = 11.84RR3 pKa = 11.84TLEE6 pKa = 3.61GTKK9 pKa = 9.97RR10 pKa = 11.84KK11 pKa = 8.92RR12 pKa = 11.84QNVSGFRR19 pKa = 11.84ARR21 pKa = 11.84MATPGGRR28 pKa = 11.84TVLNRR33 pKa = 11.84RR34 pKa = 11.84RR35 pKa = 11.84AKK37 pKa = 10.06GRR39 pKa = 11.84HH40 pKa = 5.15RR41 pKa = 11.84LAIQAKK47 pKa = 9.31KK48 pKa = 10.18RR49 pKa = 11.84AA50 pKa = 3.68
Molecular weight: 5.8 kDa
Isoelectric point according different methods:
Peptides (in silico digests for buttom-up proteomics)
Below you can find in silico digests of the whole proteome with Trypsin, Chymotrypsin, Trypsin+LysC, LysN, ArgC proteases suitable for different mass spec machines.| Try ESI |
 |
|---|
| ChTry ESI |
|
|---|
| ArgC ESI |
|
|---|
| LysN ESI |
|
|---|
| TryLysC ESI |
|
|---|
| Try MALDI |
|
|---|
| ChTry MALDI |
|
|---|
| ArgC MALDI |
|
|---|
| LysN MALDI |
|
|---|
| TryLysC MALDI |
|
|---|
| Try LTQ |
|
|---|
| ChTry LTQ |
|
|---|
| ArgC LTQ |
|
|---|
| LysN LTQ |
|
|---|
| TryLysC LTQ |
|
|---|
| Try MSlow |
|
|---|
| ChTry MSlow |
|
|---|
| ArgC MSlow |
|
|---|
| LysN MSlow |
|
|---|
| TryLysC MSlow |
|
|---|
| Try MShigh |
|
|---|
| ChTry MShigh |
|
|---|
| ArgC MShigh |
|
|---|
| LysN MShigh |
|
|---|
| TryLysC MShigh |
|
|---|
General Statistics
Number of major isoforms |
Number of additional isoforms |
Number of all proteins |
Number of amino acids |
Min. Seq. Length |
Max. Seq. Length |
Avg. Seq. Length |
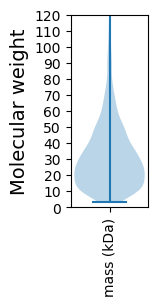
Avg. Mol. Weight |
|---|---|---|---|---|---|---|---|
0 |
626252 |
29 |
2307 |
294.0 |
33.1 |
Amino acid frequency
Ala |
Cys |
Asp |
Glu |
Phe |
Gly |
His |
Ile |
Lys |
Leu |
|---|---|---|---|---|---|---|---|---|---|
7.202 ± 0.054 | 1.272 ± 0.027 |
5.769 ± 0.051 | 6.783 ± 0.058 |
4.509 ± 0.046 | 5.767 ± 0.072 |
1.523 ± 0.021 | 8.146 ± 0.054 |
9.097 ± 0.068 | 8.844 ± 0.053 |
Met |
Asn |
Gln |
Pro |
Arg |
Ser |
Thr |
Val |
Trp |
Tyr |
|---|---|---|---|---|---|---|---|---|---|
2.53 ± 0.03 | 6.187 ± 0.062 |
3.321 ± 0.034 | 3.534 ± 0.033 |
3.276 ± 0.037 | 6.063 ± 0.048 |
5.392 ± 0.045 | 6.157 ± 0.047 |
0.678 ± 0.016 | 3.946 ± 0.04 |
Most of the basic statistics you can see at this page can be downloaded from this CSV file
See this proteome in:

Proteome-pI is available under Creative Commons Attribution-NoDerivs license, for more details see here
| Reference: Kozlowski LP. Proteome-pI 2.0: Proteome Isoelectric Point Database Update. Nucleic Acids Res. 2021, doi: 10.1093/nar/gkab944 | Contact: Lukasz P. Kozlowski |