Mycobacterium phage GaugeLDP
Taxonomy: Viruses; Duplodnaviria; Heunggongvirae; Uroviricota; Caudoviricetes; Caudovirales; Siphoviridae; Fromanvirus; unclassified Fromanvirus
Average proteome isoelectric point is 6.28
Get precalculated fractions of proteins
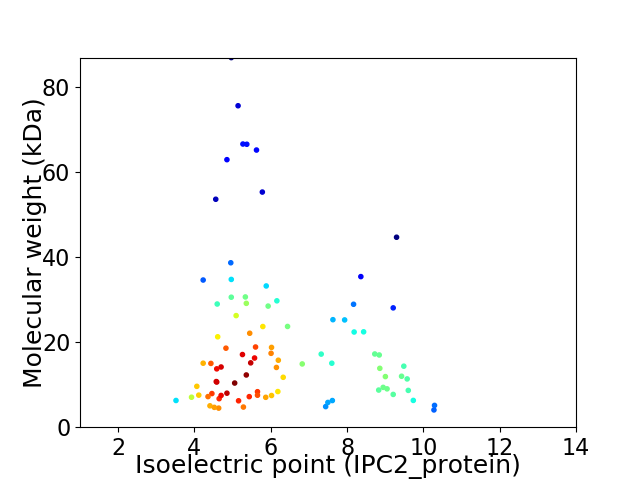
Virtual 2D-PAGE plot for 90 proteins (isoelectric point calculated using IPC2_protein)
Get csv file with sequences according to given criteria:
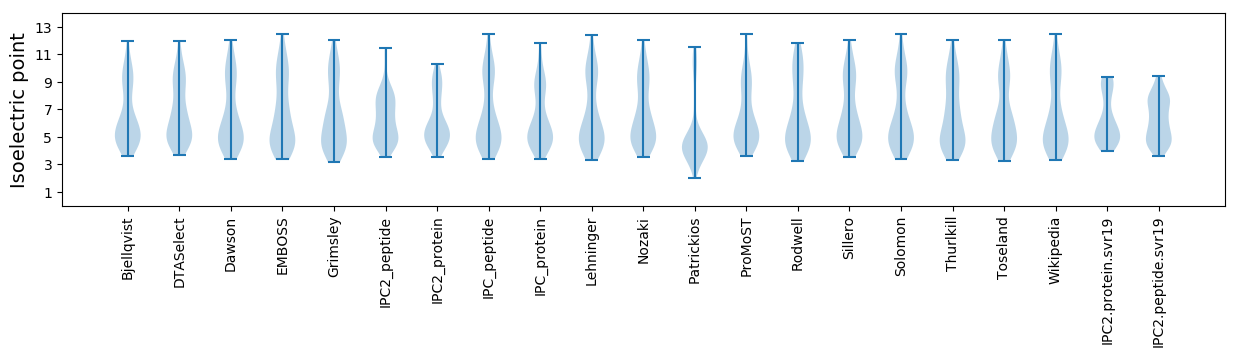
* You can choose from 21 different methods for calculating isoelectric point
Summary statistics related to proteome-wise predictions
Protein with the lowest isoelectric point:
>tr|A0A5P8D965|A0A5P8D965_9CAUD Immunity repressor OS=Mycobacterium phage GaugeLDP OX=2652419 GN=71 PE=4 SV=1
MM1 pKa = 7.57KK2 pKa = 10.15SYY4 pKa = 10.83FITISIAFVTAITVLTFADD23 pKa = 4.66DD24 pKa = 3.58EE25 pKa = 4.77ASANVPFTQAAFPCEE40 pKa = 3.95EE41 pKa = 4.7DD42 pKa = 3.63EE43 pKa = 4.58VLGYY47 pKa = 10.86APQFGPNNVGCIHH60 pKa = 6.83VDD62 pKa = 4.37LIKK65 pKa = 10.72RR66 pKa = 3.64
MM1 pKa = 7.57KK2 pKa = 10.15SYY4 pKa = 10.83FITISIAFVTAITVLTFADD23 pKa = 4.66DD24 pKa = 3.58EE25 pKa = 4.77ASANVPFTQAAFPCEE40 pKa = 3.95EE41 pKa = 4.7DD42 pKa = 3.63EE43 pKa = 4.58VLGYY47 pKa = 10.86APQFGPNNVGCIHH60 pKa = 6.83VDD62 pKa = 4.37LIKK65 pKa = 10.72RR66 pKa = 3.64
Molecular weight: 7.2 kDa
Isoelectric point according different methods:
Protein with the highest isoelectric point:
>tr|A0A5P8D9X6|A0A5P8D9X6_9CAUD Uncharacterized protein OS=Mycobacterium phage GaugeLDP OX=2652419 GN=48 PE=4 SV=1
MM1 pKa = 7.9PPRR4 pKa = 11.84ASIQQTAEE12 pKa = 3.81YY13 pKa = 10.28LGVHH17 pKa = 6.02VNTVRR22 pKa = 11.84NYY24 pKa = 9.35IAEE27 pKa = 4.6GKK29 pKa = 10.0LKK31 pKa = 10.4AVRR34 pKa = 11.84LGPRR38 pKa = 11.84LIRR41 pKa = 11.84VEE43 pKa = 4.05RR44 pKa = 11.84DD45 pKa = 3.15SVEE48 pKa = 3.78ALMRR52 pKa = 11.84PIGKK56 pKa = 9.51
MM1 pKa = 7.9PPRR4 pKa = 11.84ASIQQTAEE12 pKa = 3.81YY13 pKa = 10.28LGVHH17 pKa = 6.02VNTVRR22 pKa = 11.84NYY24 pKa = 9.35IAEE27 pKa = 4.6GKK29 pKa = 10.0LKK31 pKa = 10.4AVRR34 pKa = 11.84LGPRR38 pKa = 11.84LIRR41 pKa = 11.84VEE43 pKa = 4.05RR44 pKa = 11.84DD45 pKa = 3.15SVEE48 pKa = 3.78ALMRR52 pKa = 11.84PIGKK56 pKa = 9.51
Molecular weight: 6.3 kDa
Isoelectric point according different methods:
Peptides (in silico digests for buttom-up proteomics)
Below you can find in silico digests of the whole proteome with Trypsin, Chymotrypsin, Trypsin+LysC, LysN, ArgC proteases suitable for different mass spec machines.| Try ESI |
 |
|---|
| ChTry ESI |
|
|---|
| ArgC ESI |
|
|---|
| LysN ESI |
|
|---|
| TryLysC ESI |
|
|---|
| Try MALDI |
|
|---|
| ChTry MALDI |
|
|---|
| ArgC MALDI |
|
|---|
| LysN MALDI |
|
|---|
| TryLysC MALDI |
|
|---|
| Try LTQ |
|
|---|
| ChTry LTQ |
|
|---|
| ArgC LTQ |
|
|---|
| LysN LTQ |
|
|---|
| TryLysC LTQ |
|
|---|
| Try MSlow |
|
|---|
| ChTry MSlow |
|
|---|
| ArgC MSlow |
|
|---|
| LysN MSlow |
|
|---|
| TryLysC MSlow |
|
|---|
| Try MShigh |
|
|---|
| ChTry MShigh |
|
|---|
| ArgC MShigh |
|
|---|
| LysN MShigh |
|
|---|
| TryLysC MShigh |
|
|---|
General Statistics
Number of major isoforms |
Number of additional isoforms |
Number of all proteins |
Number of amino acids |
Min. Seq. Length |
Max. Seq. Length |
Avg. Seq. Length |
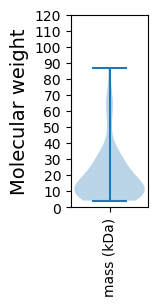
Avg. Mol. Weight |
|---|---|---|---|---|---|---|---|
0 |
16525 |
33 |
839 |
183.6 |
20.29 |
Amino acid frequency
Ala |
Cys |
Asp |
Glu |
Phe |
Gly |
His |
Ile |
Lys |
Leu |
|---|---|---|---|---|---|---|---|---|---|
10.033 ± 0.378 | 0.853 ± 0.102 |
6.142 ± 0.224 | 6.796 ± 0.31 |
3.377 ± 0.183 | 8.424 ± 0.454 |
1.961 ± 0.147 | 5.005 ± 0.171 |
4.623 ± 0.227 | 8.182 ± 0.356 |
Met |
Asn |
Gln |
Pro |
Arg |
Ser |
Thr |
Val |
Trp |
Tyr |
|---|---|---|---|---|---|---|---|---|---|
2.596 ± 0.141 | 3.201 ± 0.193 |
5.731 ± 0.285 | 3.631 ± 0.191 |
6.608 ± 0.392 | 5.216 ± 0.224 |
5.888 ± 0.235 | 6.959 ± 0.217 |
1.9 ± 0.154 | 2.874 ± 0.179 |
Most of the basic statistics you can see at this page can be downloaded from this CSV file
See this proteome in:

Proteome-pI is available under Creative Commons Attribution-NoDerivs license, for more details see here
| Reference: Kozlowski LP. Proteome-pI 2.0: Proteome Isoelectric Point Database Update. Nucleic Acids Res. 2021, doi: 10.1093/nar/gkab944 | Contact: Lukasz P. Kozlowski |