Cereibacter changlensis JA139
Taxonomy: cellular organisms; Bacteria; Proteobacteria; Alphaproteobacteria; Rhodobacterales; Rhodobacteraceae; Cereibacter; Cereibacter changlensis
Average proteome isoelectric point is 6.43
Get precalculated fractions of proteins
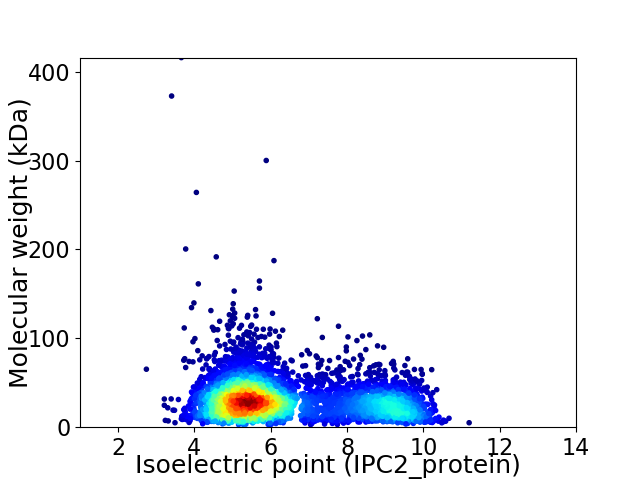
Virtual 2D-PAGE plot for 4709 proteins (isoelectric point calculated using IPC2_protein)
Get csv file with sequences according to given criteria:
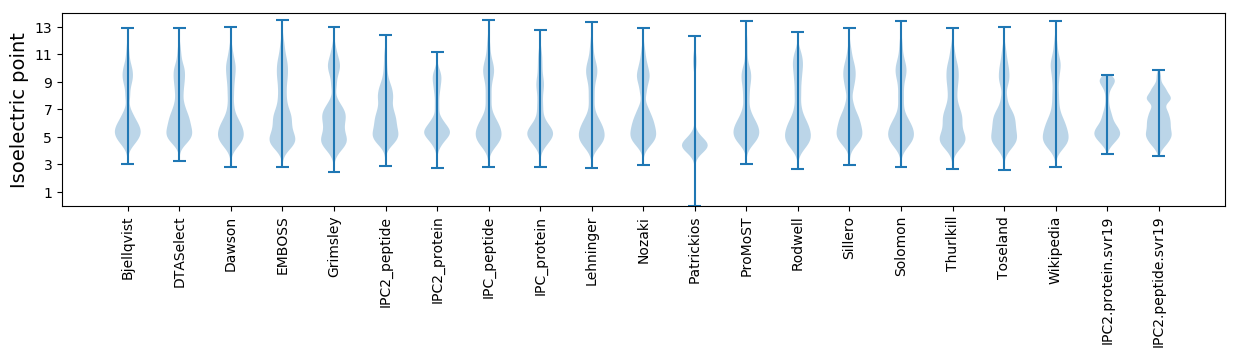
* You can choose from 21 different methods for calculating isoelectric point
Summary statistics related to proteome-wise predictions
Protein with the lowest isoelectric point:
>tr|A0A2T4JSD4|A0A2T4JSD4_9RHOB Elongation factor Tu (Fragment) OS=Cereibacter changlensis JA139 OX=1188249 GN=tuf PE=4 SV=1
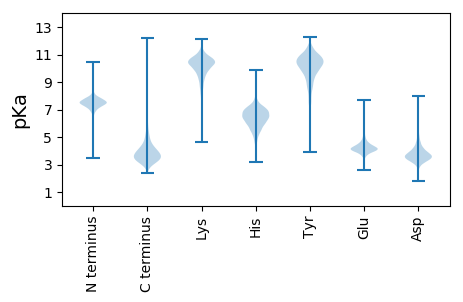
MM1 pKa = 6.89THH3 pKa = 6.21SADD6 pKa = 3.9MIEE9 pKa = 4.43GAPLIKK15 pKa = 10.22PSTTDD20 pKa = 2.8HH21 pKa = 7.07PLYY24 pKa = 10.78DD25 pKa = 4.17SVVEE29 pKa = 4.12ACRR32 pKa = 11.84SVFDD36 pKa = 4.4PEE38 pKa = 4.25IPVNIYY44 pKa = 10.88DD45 pKa = 4.22LGLVYY50 pKa = 10.32TIDD53 pKa = 3.22ISPEE57 pKa = 3.91NEE59 pKa = 3.75VEE61 pKa = 4.12ILMTLTAPGCPVAGEE76 pKa = 4.15MPGWVADD83 pKa = 3.75AVEE86 pKa = 5.1PIAGVKK92 pKa = 8.59QVNVGMTFDD101 pKa = 4.79PPWGMEE107 pKa = 3.87MMSDD111 pKa = 3.74EE112 pKa = 4.65ARR114 pKa = 11.84LEE116 pKa = 4.14LGFMM120 pKa = 4.54
MM1 pKa = 6.89THH3 pKa = 6.21SADD6 pKa = 3.9MIEE9 pKa = 4.43GAPLIKK15 pKa = 10.22PSTTDD20 pKa = 2.8HH21 pKa = 7.07PLYY24 pKa = 10.78DD25 pKa = 4.17SVVEE29 pKa = 4.12ACRR32 pKa = 11.84SVFDD36 pKa = 4.4PEE38 pKa = 4.25IPVNIYY44 pKa = 10.88DD45 pKa = 4.22LGLVYY50 pKa = 10.32TIDD53 pKa = 3.22ISPEE57 pKa = 3.91NEE59 pKa = 3.75VEE61 pKa = 4.12ILMTLTAPGCPVAGEE76 pKa = 4.15MPGWVADD83 pKa = 3.75AVEE86 pKa = 5.1PIAGVKK92 pKa = 8.59QVNVGMTFDD101 pKa = 4.79PPWGMEE107 pKa = 3.87MMSDD111 pKa = 3.74EE112 pKa = 4.65ARR114 pKa = 11.84LEE116 pKa = 4.14LGFMM120 pKa = 4.54
Molecular weight: 13.03 kDa
Isoelectric point according different methods:
Protein with the highest isoelectric point:
>tr|A0A2T4K038|A0A2T4K038_9RHOB Uncharacterized protein OS=Cereibacter changlensis JA139 OX=1188249 GN=C5F48_01430 PE=4 SV=1
MM1 pKa = 7.45KK2 pKa = 9.61RR3 pKa = 11.84TFQPSNLVRR12 pKa = 11.84ARR14 pKa = 11.84RR15 pKa = 11.84HH16 pKa = 4.37GFRR19 pKa = 11.84ARR21 pKa = 11.84MATKK25 pKa = 10.34GGRR28 pKa = 11.84LVLAARR34 pKa = 11.84RR35 pKa = 11.84AKK37 pKa = 10.1GRR39 pKa = 11.84KK40 pKa = 8.83KK41 pKa = 10.63LSAA44 pKa = 3.95
MM1 pKa = 7.45KK2 pKa = 9.61RR3 pKa = 11.84TFQPSNLVRR12 pKa = 11.84ARR14 pKa = 11.84RR15 pKa = 11.84HH16 pKa = 4.37GFRR19 pKa = 11.84ARR21 pKa = 11.84MATKK25 pKa = 10.34GGRR28 pKa = 11.84LVLAARR34 pKa = 11.84RR35 pKa = 11.84AKK37 pKa = 10.1GRR39 pKa = 11.84KK40 pKa = 8.83KK41 pKa = 10.63LSAA44 pKa = 3.95
Molecular weight: 5.01 kDa
Isoelectric point according different methods:
Peptides (in silico digests for buttom-up proteomics)
Below you can find in silico digests of the whole proteome with Trypsin, Chymotrypsin, Trypsin+LysC, LysN, ArgC proteases suitable for different mass spec machines.| Try ESI |
 |
|---|
| ChTry ESI |
|
|---|
| ArgC ESI |
|
|---|
| LysN ESI |
|
|---|
| TryLysC ESI |
|
|---|
| Try MALDI |
|
|---|
| ChTry MALDI |
|
|---|
| ArgC MALDI |
|
|---|
| LysN MALDI |
|
|---|
| TryLysC MALDI |
|
|---|
| Try LTQ |
|
|---|
| ChTry LTQ |
|
|---|
| ArgC LTQ |
|
|---|
| LysN LTQ |
|
|---|
| TryLysC LTQ |
|
|---|
| Try MSlow |
|
|---|
| ChTry MSlow |
|
|---|
| ArgC MSlow |
|
|---|
| LysN MSlow |
|
|---|
| TryLysC MSlow |
|
|---|
| Try MShigh |
|
|---|
| ChTry MShigh |
|
|---|
| ArgC MShigh |
|
|---|
| LysN MShigh |
|
|---|
| TryLysC MShigh |
|
|---|
General Statistics
Number of major isoforms |
Number of additional isoforms |
Number of all proteins |
Number of amino acids |
Min. Seq. Length |
Max. Seq. Length |
Avg. Seq. Length |
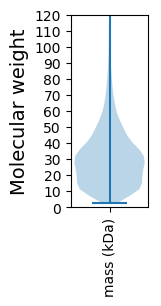
Avg. Mol. Weight |
|---|---|---|---|---|---|---|---|
0 |
1406964 |
25 |
4015 |
298.8 |
32.2 |
Amino acid frequency
Ala |
Cys |
Asp |
Glu |
Phe |
Gly |
His |
Ile |
Lys |
Leu |
|---|---|---|---|---|---|---|---|---|---|
13.458 ± 0.054 | 0.847 ± 0.011 |
5.451 ± 0.039 | 5.864 ± 0.033 |
3.547 ± 0.023 | 9.039 ± 0.035 |
1.923 ± 0.017 | 4.762 ± 0.03 |
2.564 ± 0.027 | 10.94 ± 0.054 |
Met |
Asn |
Gln |
Pro |
Arg |
Ser |
Thr |
Val |
Trp |
Tyr |
|---|---|---|---|---|---|---|---|---|---|
2.662 ± 0.02 | 2.177 ± 0.022 |
5.359 ± 0.032 | 3.084 ± 0.019 |
7.293 ± 0.047 | 5.035 ± 0.028 |
5.298 ± 0.032 | 7.327 ± 0.031 |
1.366 ± 0.015 | 2.004 ± 0.019 |
Most of the basic statistics you can see at this page can be downloaded from this CSV file
See this proteome in:

Proteome-pI is available under Creative Commons Attribution-NoDerivs license, for more details see here
| Reference: Kozlowski LP. Proteome-pI 2.0: Proteome Isoelectric Point Database Update. Nucleic Acids Res. 2021, doi: 10.1093/nar/gkab944 | Contact: Lukasz P. Kozlowski |