Flavobacterium phage vB_FspS_morran9-1
Taxonomy: Viruses; Duplodnaviria; Heunggongvirae; Uroviricota; Caudoviricetes; Caudovirales; Siphoviridae; Lillamyvirus; Flavobacterium virus Morran
Average proteome isoelectric point is 6.88
Get precalculated fractions of proteins
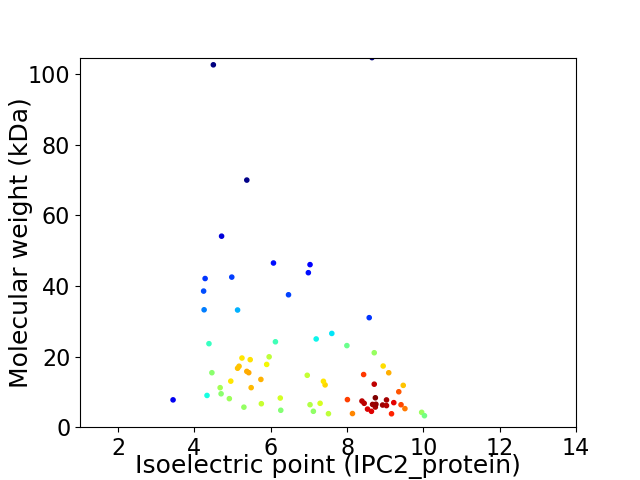
Virtual 2D-PAGE plot for 73 proteins (isoelectric point calculated using IPC2_protein)
Get csv file with sequences according to given criteria:
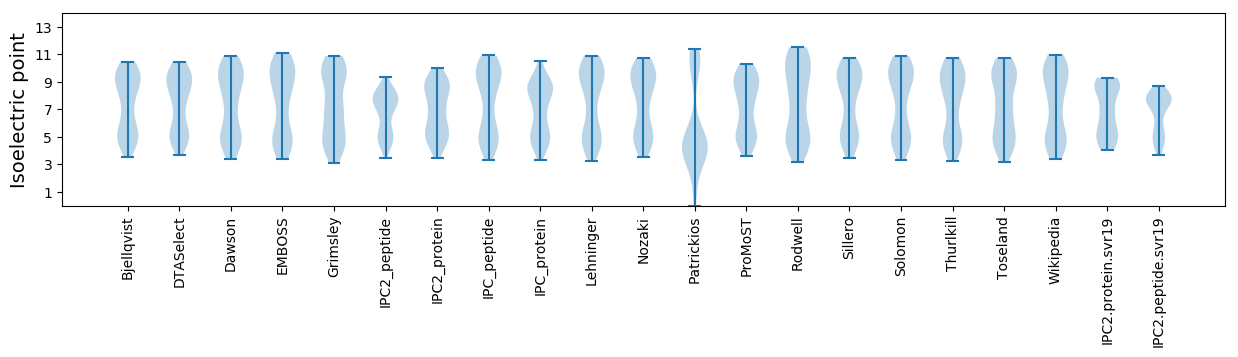
* You can choose from 21 different methods for calculating isoelectric point
Summary statistics related to proteome-wise predictions
Protein with the lowest isoelectric point:
>tr|A0A6B9LDZ4|A0A6B9LDZ4_9CAUD Uncharacterized protein OS=Flavobacterium phage vB_FspS_morran9-1 OX=2686258 GN=morran91_gp059 PE=4 SV=1
MM1 pKa = 7.13TKK3 pKa = 10.25FVIMKK8 pKa = 7.91TLKK11 pKa = 10.69LLLITALAILFLSCSNDD28 pKa = 3.34DD29 pKa = 4.75NEE31 pKa = 4.51QCTYY35 pKa = 9.76TCNAWVKK42 pKa = 10.29PDD44 pKa = 3.4GQIRR48 pKa = 11.84TVIPVEE54 pKa = 4.25LNCEE58 pKa = 4.08TNEE61 pKa = 4.67PINLPEE67 pKa = 4.47GYY69 pKa = 9.92IFLGCDD75 pKa = 3.18NDD77 pKa = 4.19NIPP80 pKa = 4.55
MM1 pKa = 7.13TKK3 pKa = 10.25FVIMKK8 pKa = 7.91TLKK11 pKa = 10.69LLLITALAILFLSCSNDD28 pKa = 3.34DD29 pKa = 4.75NEE31 pKa = 4.51QCTYY35 pKa = 9.76TCNAWVKK42 pKa = 10.29PDD44 pKa = 3.4GQIRR48 pKa = 11.84TVIPVEE54 pKa = 4.25LNCEE58 pKa = 4.08TNEE61 pKa = 4.67PINLPEE67 pKa = 4.47GYY69 pKa = 9.92IFLGCDD75 pKa = 3.18NDD77 pKa = 4.19NIPP80 pKa = 4.55
Molecular weight: 8.99 kDa
Isoelectric point according different methods:
Protein with the highest isoelectric point:
>tr|A0A6B9LC93|A0A6B9LC93_9CAUD Uncharacterized protein OS=Flavobacterium phage vB_FspS_morran9-1 OX=2686258 GN=morran91_gp032 PE=4 SV=1
MM1 pKa = 7.84WSRR4 pKa = 11.84NSEE7 pKa = 4.15SFSFRR12 pKa = 11.84LIYY15 pKa = 9.77RR16 pKa = 11.84HH17 pKa = 5.53KK18 pKa = 10.85NKK20 pKa = 10.48YY21 pKa = 10.1KK22 pKa = 10.83LITNATIAYY31 pKa = 7.4NRR33 pKa = 11.84CC34 pKa = 3.15
MM1 pKa = 7.84WSRR4 pKa = 11.84NSEE7 pKa = 4.15SFSFRR12 pKa = 11.84LIYY15 pKa = 9.77RR16 pKa = 11.84HH17 pKa = 5.53KK18 pKa = 10.85NKK20 pKa = 10.48YY21 pKa = 10.1KK22 pKa = 10.83LITNATIAYY31 pKa = 7.4NRR33 pKa = 11.84CC34 pKa = 3.15
Molecular weight: 4.21 kDa
Isoelectric point according different methods:
Peptides (in silico digests for buttom-up proteomics)
Below you can find in silico digests of the whole proteome with Trypsin, Chymotrypsin, Trypsin+LysC, LysN, ArgC proteases suitable for different mass spec machines.| Try ESI |
 |
|---|
| ChTry ESI |
|
|---|
| ArgC ESI |
|
|---|
| LysN ESI |
|
|---|
| TryLysC ESI |
|
|---|
| Try MALDI |
|
|---|
| ChTry MALDI |
|
|---|
| ArgC MALDI |
|
|---|
| LysN MALDI |
|
|---|
| TryLysC MALDI |
|
|---|
| Try LTQ |
|
|---|
| ChTry LTQ |
|
|---|
| ArgC LTQ |
|
|---|
| LysN LTQ |
|
|---|
| TryLysC LTQ |
|
|---|
| Try MSlow |
|
|---|
| ChTry MSlow |
|
|---|
| ArgC MSlow |
|
|---|
| LysN MSlow |
|
|---|
| TryLysC MSlow |
|
|---|
| Try MShigh |
|
|---|
| ChTry MShigh |
|
|---|
| ArgC MShigh |
|
|---|
| LysN MShigh |
|
|---|
| TryLysC MShigh |
|
|---|
General Statistics
Number of major isoforms |
Number of additional isoforms |
Number of all proteins |
Number of amino acids |
Min. Seq. Length |
Max. Seq. Length |
Avg. Seq. Length |
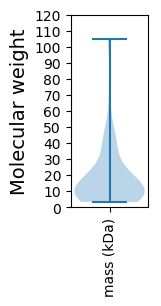
Avg. Mol. Weight |
|---|---|---|---|---|---|---|---|
0 |
12113 |
30 |
931 |
165.9 |
19.05 |
Amino acid frequency
Ala |
Cys |
Asp |
Glu |
Phe |
Gly |
His |
Ile |
Lys |
Leu |
|---|---|---|---|---|---|---|---|---|---|
4.986 ± 0.393 | 1.123 ± 0.174 |
5.531 ± 0.287 | 7.331 ± 0.349 |
4.97 ± 0.236 | 4.689 ± 0.268 |
1.313 ± 0.202 | 8.074 ± 0.292 |
9.527 ± 0.587 | 8.99 ± 0.281 |
Met |
Asn |
Gln |
Pro |
Arg |
Ser |
Thr |
Val |
Trp |
Tyr |
|---|---|---|---|---|---|---|---|---|---|
2.262 ± 0.142 | 8.0 ± 0.315 |
2.534 ± 0.164 | 4.053 ± 0.341 |
3.03 ± 0.173 | 6.406 ± 0.332 |
6.497 ± 0.42 | 5.358 ± 0.199 |
0.933 ± 0.084 | 4.392 ± 0.27 |
Most of the basic statistics you can see at this page can be downloaded from this CSV file
See this proteome in:

Proteome-pI is available under Creative Commons Attribution-NoDerivs license, for more details see here
| Reference: Kozlowski LP. Proteome-pI 2.0: Proteome Isoelectric Point Database Update. Nucleic Acids Res. 2021, doi: 10.1093/nar/gkab944 | Contact: Lukasz P. Kozlowski |