Schaalia cardiffensis F0333
Taxonomy: cellular organisms; Bacteria; Terrabacteria group; Actinobacteria; Actinomycetia; Actinomycetales; Actinomycetaceae; Schaalia; Schaalia cardiffensis
Average proteome isoelectric point is 6.17
Get precalculated fractions of proteins
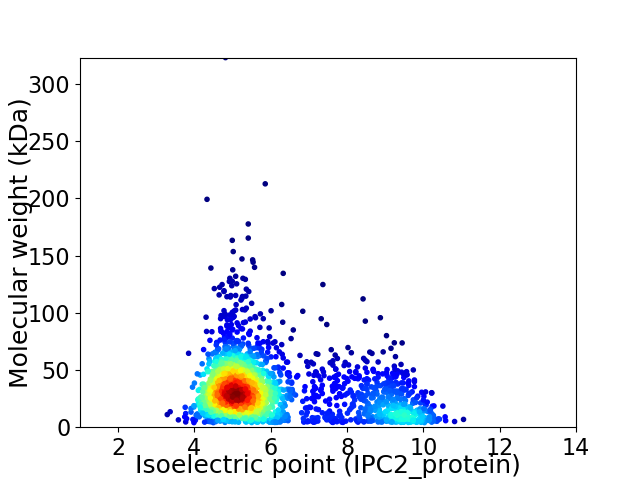
Virtual 2D-PAGE plot for 1983 proteins (isoelectric point calculated using IPC2_protein)
Get csv file with sequences according to given criteria:
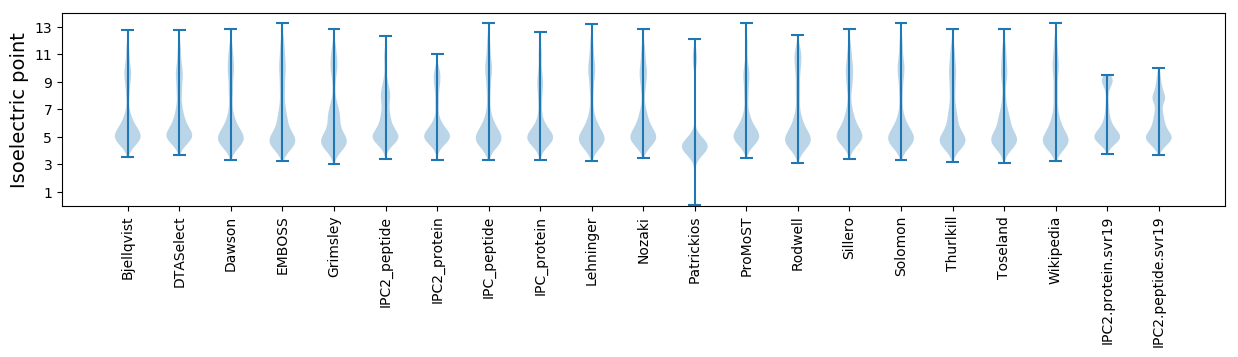
* You can choose from 21 different methods for calculating isoelectric point
Summary statistics related to proteome-wise predictions
Protein with the lowest isoelectric point:
>tr|N6W604|N6W604_9ACTO Integral membrane protein OS=Schaalia cardiffensis F0333 OX=888050 GN=HMPREF9004_1344 PE=4 SV=1
MM1 pKa = 7.7WIICGGEE8 pKa = 3.94QRR10 pKa = 11.84ISWYY14 pKa = 8.79FTVEE18 pKa = 4.01NVSDD22 pKa = 3.44QTFEE26 pKa = 4.28AFHH29 pKa = 6.46SLSVPDD35 pKa = 4.83PALDD39 pKa = 4.25PYY41 pKa = 9.57PASGVVIPDD50 pKa = 3.54DD51 pKa = 3.84PKK53 pKa = 10.96GFLVVPEE60 pKa = 5.05GII62 pKa = 3.84
MM1 pKa = 7.7WIICGGEE8 pKa = 3.94QRR10 pKa = 11.84ISWYY14 pKa = 8.79FTVEE18 pKa = 4.01NVSDD22 pKa = 3.44QTFEE26 pKa = 4.28AFHH29 pKa = 6.46SLSVPDD35 pKa = 4.83PALDD39 pKa = 4.25PYY41 pKa = 9.57PASGVVIPDD50 pKa = 3.54DD51 pKa = 3.84PKK53 pKa = 10.96GFLVVPEE60 pKa = 5.05GII62 pKa = 3.84
Molecular weight: 6.84 kDa
Isoelectric point according different methods:
Protein with the highest isoelectric point:
>tr|N6WEG3|N6WEG3_9ACTO Hemin ABC superfamily ATP binding cassette transporter membrane protein OS=Schaalia cardiffensis F0333 OX=888050 GN=HMPREF9004_0688 PE=3 SV=1
MM1 pKa = 8.22DD2 pKa = 4.83SRR4 pKa = 11.84PPLSPRR10 pKa = 11.84RR11 pKa = 11.84TAVTTKK17 pKa = 9.88RR18 pKa = 11.84TFQPNNRR25 pKa = 11.84RR26 pKa = 11.84RR27 pKa = 11.84SKK29 pKa = 8.58THH31 pKa = 5.46GFRR34 pKa = 11.84LRR36 pKa = 11.84MSTRR40 pKa = 11.84AGRR43 pKa = 11.84AILAARR49 pKa = 11.84RR50 pKa = 11.84RR51 pKa = 11.84KK52 pKa = 9.74GRR54 pKa = 11.84AKK56 pKa = 10.68LSAA59 pKa = 3.92
MM1 pKa = 8.22DD2 pKa = 4.83SRR4 pKa = 11.84PPLSPRR10 pKa = 11.84RR11 pKa = 11.84TAVTTKK17 pKa = 9.88RR18 pKa = 11.84TFQPNNRR25 pKa = 11.84RR26 pKa = 11.84RR27 pKa = 11.84SKK29 pKa = 8.58THH31 pKa = 5.46GFRR34 pKa = 11.84LRR36 pKa = 11.84MSTRR40 pKa = 11.84AGRR43 pKa = 11.84AILAARR49 pKa = 11.84RR50 pKa = 11.84RR51 pKa = 11.84KK52 pKa = 9.74GRR54 pKa = 11.84AKK56 pKa = 10.68LSAA59 pKa = 3.92
Molecular weight: 6.8 kDa
Isoelectric point according different methods:
Peptides (in silico digests for buttom-up proteomics)
Below you can find in silico digests of the whole proteome with Trypsin, Chymotrypsin, Trypsin+LysC, LysN, ArgC proteases suitable for different mass spec machines.| Try ESI |
 |
|---|
| ChTry ESI |
|
|---|
| ArgC ESI |
|
|---|
| LysN ESI |
|
|---|
| TryLysC ESI |
|
|---|
| Try MALDI |
|
|---|
| ChTry MALDI |
|
|---|
| ArgC MALDI |
|
|---|
| LysN MALDI |
|
|---|
| TryLysC MALDI |
|
|---|
| Try LTQ |
|
|---|
| ChTry LTQ |
|
|---|
| ArgC LTQ |
|
|---|
| LysN LTQ |
|
|---|
| TryLysC LTQ |
|
|---|
| Try MSlow |
|
|---|
| ChTry MSlow |
|
|---|
| ArgC MSlow |
|
|---|
| LysN MSlow |
|
|---|
| TryLysC MSlow |
|
|---|
| Try MShigh |
|
|---|
| ChTry MShigh |
|
|---|
| ArgC MShigh |
|
|---|
| LysN MShigh |
|
|---|
| TryLysC MShigh |
|
|---|
General Statistics
Number of major isoforms |
Number of additional isoforms |
Number of all proteins |
Number of amino acids |
Min. Seq. Length |
Max. Seq. Length |
Avg. Seq. Length |
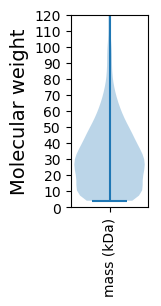
Avg. Mol. Weight |
|---|---|---|---|---|---|---|---|
0 |
628407 |
37 |
3061 |
316.9 |
34.3 |
Amino acid frequency
Ala |
Cys |
Asp |
Glu |
Phe |
Gly |
His |
Ile |
Lys |
Leu |
|---|---|---|---|---|---|---|---|---|---|
11.674 ± 0.069 | 0.825 ± 0.017 |
5.613 ± 0.048 | 6.811 ± 0.053 |
3.112 ± 0.036 | 8.345 ± 0.05 |
2.147 ± 0.029 | 5.08 ± 0.041 |
3.035 ± 0.044 | 10.158 ± 0.064 |
Met |
Asn |
Gln |
Pro |
Arg |
Ser |
Thr |
Val |
Trp |
Tyr |
|---|---|---|---|---|---|---|---|---|---|
2.232 ± 0.027 | 2.291 ± 0.029 |
5.243 ± 0.048 | 2.992 ± 0.039 |
6.91 ± 0.064 | 6.768 ± 0.053 |
5.687 ± 0.042 | 7.73 ± 0.054 |
1.423 ± 0.026 | 1.925 ± 0.027 |
Most of the basic statistics you can see at this page can be downloaded from this CSV file
See this proteome in:

Proteome-pI is available under Creative Commons Attribution-NoDerivs license, for more details see here
| Reference: Kozlowski LP. Proteome-pI 2.0: Proteome Isoelectric Point Database Update. Nucleic Acids Res. 2021, doi: 10.1093/nar/gkab944 | Contact: Lukasz P. Kozlowski |