Spirosoma sp. HMF3257
Taxonomy: cellular organisms; Bacteria; FCB group; Bacteroidetes/Chlorobi group; Bacteroidetes; Cytophagia; Cytophagales; Cytophagaceae; Spirosoma; unclassified Spirosoma
Average proteome isoelectric point is 6.85
Get precalculated fractions of proteins
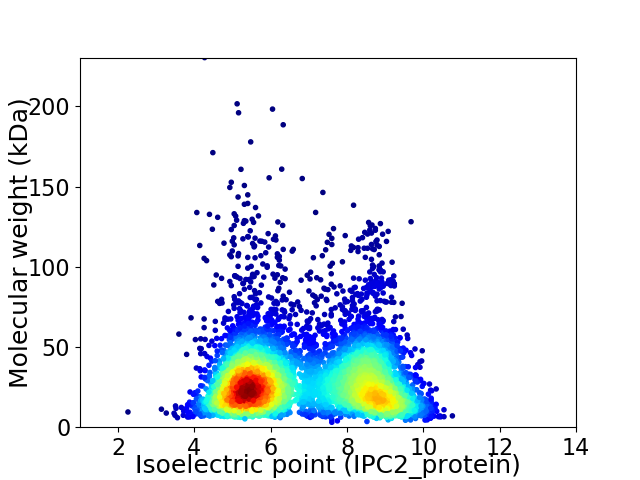
Virtual 2D-PAGE plot for 5857 proteins (isoelectric point calculated using IPC2_protein)
Get csv file with sequences according to given criteria:
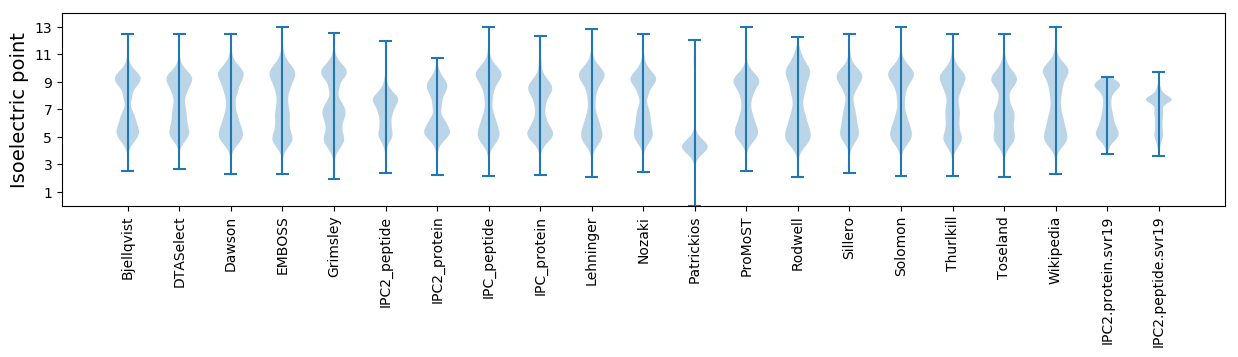
* You can choose from 21 different methods for calculating isoelectric point
Summary statistics related to proteome-wise predictions
Protein with the lowest isoelectric point:
>tr|A0A327NHZ9|A0A327NHZ9_9BACT Type III pantothenate kinase OS=Spirosoma sp. HMF3257 OX=2183553 GN=coaX PE=3 SV=1
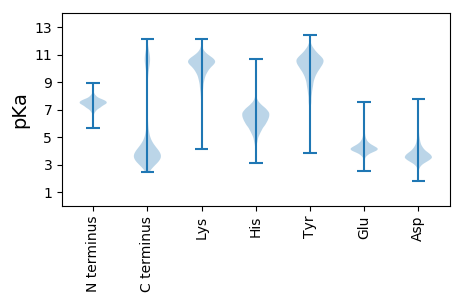
MM1 pKa = 7.71PAGLDD6 pKa = 3.59FDD8 pKa = 4.25PTTGVISGTPTNIGQFGITIGTSDD32 pKa = 3.72SQSTVYY38 pKa = 10.37RR39 pKa = 11.84GFYY42 pKa = 10.23LQINSSATVNLPPVVVSNLSSPITRR67 pKa = 11.84DD68 pKa = 2.6IYY70 pKa = 9.61QTISIPAAYY79 pKa = 10.19AFTDD83 pKa = 4.07PKK85 pKa = 11.16DD86 pKa = 3.68DD87 pKa = 3.9PP88 pKa = 4.69
MM1 pKa = 7.71PAGLDD6 pKa = 3.59FDD8 pKa = 4.25PTTGVISGTPTNIGQFGITIGTSDD32 pKa = 3.72SQSTVYY38 pKa = 10.37RR39 pKa = 11.84GFYY42 pKa = 10.23LQINSSATVNLPPVVVSNLSSPITRR67 pKa = 11.84DD68 pKa = 2.6IYY70 pKa = 9.61QTISIPAAYY79 pKa = 10.19AFTDD83 pKa = 4.07PKK85 pKa = 11.16DD86 pKa = 3.68DD87 pKa = 3.9PP88 pKa = 4.69
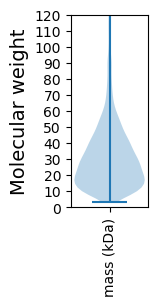
Molecular weight: 9.28 kDa
Isoelectric point according different methods:
Protein with the highest isoelectric point:
>tr|A0A327NKB0|A0A327NKB0_9BACT Phosphatidylglycerophosphatase A OS=Spirosoma sp. HMF3257 OX=2183553 GN=HMF3257_18140 PE=4 SV=1
MM1 pKa = 7.24NTPQTQQTKK10 pKa = 8.06RR11 pKa = 11.84TFRR14 pKa = 11.84VIALLGGLFLVIGVILRR31 pKa = 11.84LSGLLITATFAMALAGGVGLLLGLIGMATAQRR63 pKa = 11.84MKK65 pKa = 10.59PKK67 pKa = 10.54
MM1 pKa = 7.24NTPQTQQTKK10 pKa = 8.06RR11 pKa = 11.84TFRR14 pKa = 11.84VIALLGGLFLVIGVILRR31 pKa = 11.84LSGLLITATFAMALAGGVGLLLGLIGMATAQRR63 pKa = 11.84MKK65 pKa = 10.59PKK67 pKa = 10.54
Molecular weight: 7.05 kDa
Isoelectric point according different methods:
Peptides (in silico digests for buttom-up proteomics)
Below you can find in silico digests of the whole proteome with Trypsin, Chymotrypsin, Trypsin+LysC, LysN, ArgC proteases suitable for different mass spec machines.| Try ESI |
 |
|---|
| ChTry ESI |
|
|---|
| ArgC ESI |
|
|---|
| LysN ESI |
|
|---|
| TryLysC ESI |
|
|---|
| Try MALDI |
|
|---|
| ChTry MALDI |
|
|---|
| ArgC MALDI |
|
|---|
| LysN MALDI |
|
|---|
| TryLysC MALDI |
|
|---|
| Try LTQ |
|
|---|
| ChTry LTQ |
|
|---|
| ArgC LTQ |
|
|---|
| LysN LTQ |
|
|---|
| TryLysC LTQ |
|
|---|
| Try MSlow |
|
|---|
| ChTry MSlow |
|
|---|
| ArgC MSlow |
|
|---|
| LysN MSlow |
|
|---|
| TryLysC MSlow |
|
|---|
| Try MShigh |
|
|---|
| ChTry MShigh |
|
|---|
| ArgC MShigh |
|
|---|
| LysN MShigh |
|
|---|
| TryLysC MShigh |
|
|---|
General Statistics
Number of major isoforms |
Number of additional isoforms |
Number of all proteins |
Number of amino acids |
Min. Seq. Length |
Max. Seq. Length |
Avg. Seq. Length |
Avg. Mol. Weight |
|---|---|---|---|---|---|---|---|
0 |
1723158 |
26 |
2328 |
294.2 |
32.83 |
Amino acid frequency
Ala |
Cys |
Asp |
Glu |
Phe |
Gly |
His |
Ile |
Lys |
Leu |
|---|---|---|---|---|---|---|---|---|---|
7.943 ± 0.033 | 0.818 ± 0.011 |
5.202 ± 0.026 | 5.16 ± 0.034 |
4.505 ± 0.023 | 6.887 ± 0.033 |
1.865 ± 0.016 | 6.218 ± 0.025 |
5.346 ± 0.034 | 10.192 ± 0.043 |
Met |
Asn |
Gln |
Pro |
Arg |
Ser |
Thr |
Val |
Trp |
Tyr |
|---|---|---|---|---|---|---|---|---|---|
2.117 ± 0.014 | 4.733 ± 0.029 |
4.49 ± 0.02 | 4.519 ± 0.026 |
4.94 ± 0.026 | 6.526 ± 0.034 |
6.715 ± 0.042 | 6.665 ± 0.026 |
1.311 ± 0.013 | 3.845 ± 0.021 |
Most of the basic statistics you can see at this page can be downloaded from this CSV file
See this proteome in:

Proteome-pI is available under Creative Commons Attribution-NoDerivs license, for more details see here
| Reference: Kozlowski LP. Proteome-pI 2.0: Proteome Isoelectric Point Database Update. Nucleic Acids Res. 2021, doi: 10.1093/nar/gkab944 | Contact: Lukasz P. Kozlowski |