Gordonia phage GordTnk2
Taxonomy: Viruses; Duplodnaviria; Heunggongvirae; Uroviricota; Caudoviricetes; Caudovirales; Siphoviridae; Gordtnkvirus; Gordonia virus GordTnk2
Average proteome isoelectric point is 6.08
Get precalculated fractions of proteins
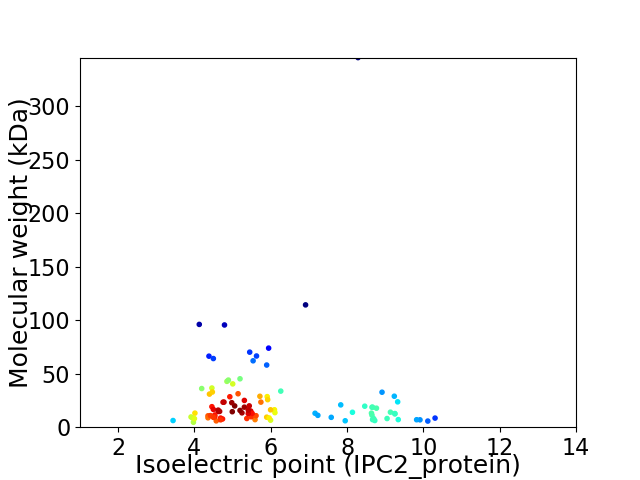
Virtual 2D-PAGE plot for 98 proteins (isoelectric point calculated using IPC2_protein)
Get csv file with sequences according to given criteria:
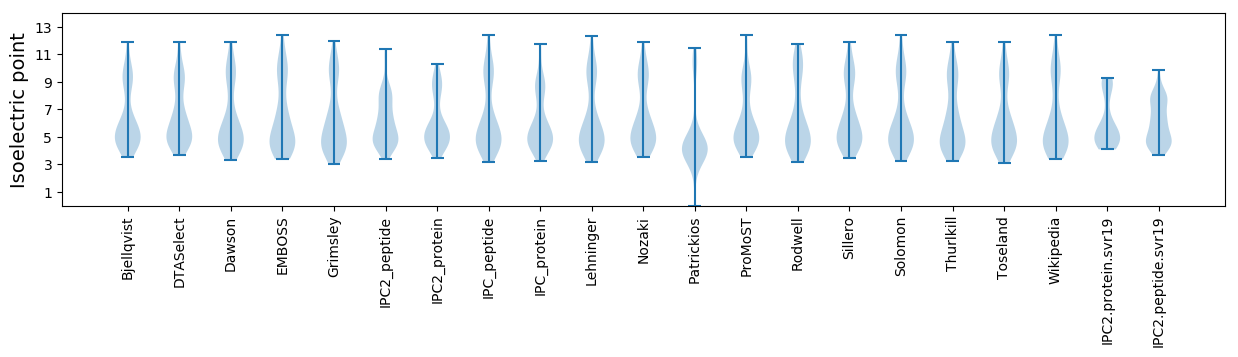
* You can choose from 21 different methods for calculating isoelectric point
Summary statistics related to proteome-wise predictions
Protein with the lowest isoelectric point:
>tr|A0A0E3T7S1|A0A0E3T7S1_9CAUD Uncharacterized protein OS=Gordonia phage GordTnk2 OX=1622192 GN=GordTnk2_5 PE=4 SV=1
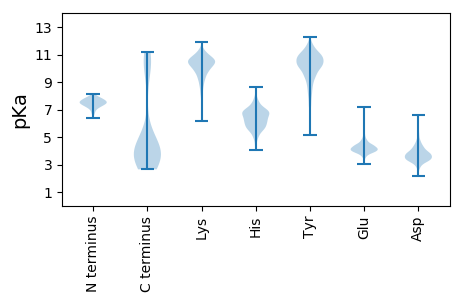
MM1 pKa = 7.08LTLVTALMVAALNLTPHH18 pKa = 7.01GDD20 pKa = 3.45VTLPIYY26 pKa = 10.34PCGDD30 pKa = 4.61GIPVYY35 pKa = 10.01VAPDD39 pKa = 3.37GTVYY43 pKa = 11.12GDD45 pKa = 3.35QNNNGTIDD53 pKa = 3.64PAEE56 pKa = 4.43CLDD59 pKa = 3.71TT60 pKa = 4.69
MM1 pKa = 7.08LTLVTALMVAALNLTPHH18 pKa = 7.01GDD20 pKa = 3.45VTLPIYY26 pKa = 10.34PCGDD30 pKa = 4.61GIPVYY35 pKa = 10.01VAPDD39 pKa = 3.37GTVYY43 pKa = 11.12GDD45 pKa = 3.35QNNNGTIDD53 pKa = 3.64PAEE56 pKa = 4.43CLDD59 pKa = 3.71TT60 pKa = 4.69
Molecular weight: 6.23 kDa
Isoelectric point according different methods:
Protein with the highest isoelectric point:
>tr|A0A0E3X9P7|A0A0E3X9P7_9CAUD Uncharacterized protein OS=Gordonia phage GordTnk2 OX=1622192 GN=GordTnk2_18 PE=4 SV=1
MM1 pKa = 7.25SAIHH5 pKa = 6.28TGPANMLGSVLNRR18 pKa = 11.84TEE20 pKa = 4.22HH21 pKa = 6.17IGRR24 pKa = 11.84VYY26 pKa = 9.12EE27 pKa = 4.19TAVSTKK33 pKa = 9.59IYY35 pKa = 9.84RR36 pKa = 11.84ARR38 pKa = 11.84EE39 pKa = 3.38RR40 pKa = 11.84AEE42 pKa = 3.83FNKK45 pKa = 10.16SVRR48 pKa = 11.84LHH50 pKa = 5.47FQPVRR55 pKa = 11.84FHH57 pKa = 7.24SSQQ60 pKa = 2.96
MM1 pKa = 7.25SAIHH5 pKa = 6.28TGPANMLGSVLNRR18 pKa = 11.84TEE20 pKa = 4.22HH21 pKa = 6.17IGRR24 pKa = 11.84VYY26 pKa = 9.12EE27 pKa = 4.19TAVSTKK33 pKa = 9.59IYY35 pKa = 9.84RR36 pKa = 11.84ARR38 pKa = 11.84EE39 pKa = 3.38RR40 pKa = 11.84AEE42 pKa = 3.83FNKK45 pKa = 10.16SVRR48 pKa = 11.84LHH50 pKa = 5.47FQPVRR55 pKa = 11.84FHH57 pKa = 7.24SSQQ60 pKa = 2.96
Molecular weight: 6.88 kDa
Isoelectric point according different methods:
Peptides (in silico digests for buttom-up proteomics)
Below you can find in silico digests of the whole proteome with Trypsin, Chymotrypsin, Trypsin+LysC, LysN, ArgC proteases suitable for different mass spec machines.| Try ESI |
 |
|---|
| ChTry ESI |
|
|---|
| ArgC ESI |
|
|---|
| LysN ESI |
|
|---|
| TryLysC ESI |
|
|---|
| Try MALDI |
|
|---|
| ChTry MALDI |
|
|---|
| ArgC MALDI |
|
|---|
| LysN MALDI |
|
|---|
| TryLysC MALDI |
|
|---|
| Try LTQ |
|
|---|
| ChTry LTQ |
|
|---|
| ArgC LTQ |
|
|---|
| LysN LTQ |
|
|---|
| TryLysC LTQ |
|
|---|
| Try MSlow |
|
|---|
| ChTry MSlow |
|
|---|
| ArgC MSlow |
|
|---|
| LysN MSlow |
|
|---|
| TryLysC MSlow |
|
|---|
| Try MShigh |
|
|---|
| ChTry MShigh |
|
|---|
| ArgC MShigh |
|
|---|
| LysN MShigh |
|
|---|
| TryLysC MShigh |
|
|---|
General Statistics
Number of major isoforms |
Number of additional isoforms |
Number of all proteins |
Number of amino acids |
Min. Seq. Length |
Max. Seq. Length |
Avg. Seq. Length |
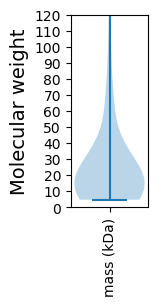
Avg. Mol. Weight |
|---|---|---|---|---|---|---|---|
0 |
23201 |
40 |
3272 |
236.7 |
26.18 |
Amino acid frequency
Ala |
Cys |
Asp |
Glu |
Phe |
Gly |
His |
Ile |
Lys |
Leu |
|---|---|---|---|---|---|---|---|---|---|
9.043 ± 0.899 | 0.978 ± 0.176 |
6.5 ± 0.418 | 6.439 ± 0.315 |
3.935 ± 0.122 | 7.672 ± 0.427 |
1.694 ± 0.206 | 5.832 ± 0.186 |
5.758 ± 0.235 | 7.34 ± 0.218 |
Met |
Asn |
Gln |
Pro |
Arg |
Ser |
Thr |
Val |
Trp |
Tyr |
|---|---|---|---|---|---|---|---|---|---|
2.81 ± 0.132 | 4.983 ± 0.162 |
4.728 ± 0.313 | 3.853 ± 0.172 |
5.077 ± 0.25 | 6.603 ± 0.25 |
5.741 ± 0.215 | 6.547 ± 0.228 |
1.496 ± 0.114 | 2.97 ± 0.192 |
Most of the basic statistics you can see at this page can be downloaded from this CSV file
See this proteome in:

Proteome-pI is available under Creative Commons Attribution-NoDerivs license, for more details see here
| Reference: Kozlowski LP. Proteome-pI 2.0: Proteome Isoelectric Point Database Update. Nucleic Acids Res. 2021, doi: 10.1093/nar/gkab944 | Contact: Lukasz P. Kozlowski |