Flavobacterium micromati
Taxonomy: cellular organisms; Bacteria; FCB group; Bacteroidetes/Chlorobi group; Bacteroidetes; Flavobacteriia; Flavobacteriales; Flavobacteriaceae; Flavobacterium
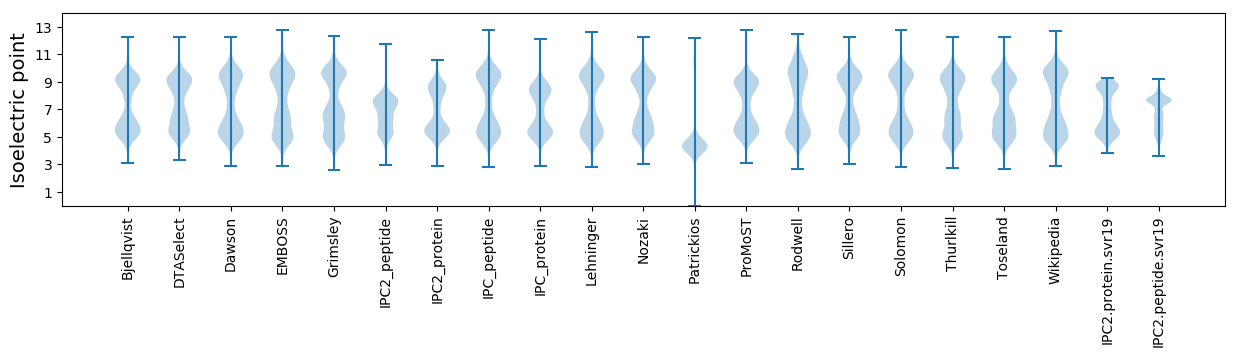
Average proteome isoelectric point is 6.78
Get precalculated fractions of proteins

Virtual 2D-PAGE plot for 3204 proteins (isoelectric point calculated using IPC2_protein)
Get csv file with sequences according to given criteria:
* You can choose from 21 different methods for calculating isoelectric point
Summary statistics related to proteome-wise predictions
Protein with the lowest isoelectric point:
>tr|A0A1M5QG01|A0A1M5QG01_9FLAO Uncharacterized protein OS=Flavobacterium micromati OX=229205 GN=SAMN05444372_11625 PE=4 SV=1
MM1 pKa = 7.59ILTSEE6 pKa = 4.67KK7 pKa = 9.97LTADD11 pKa = 3.61EE12 pKa = 4.77DD13 pKa = 3.81DD14 pKa = 3.31QRR16 pKa = 11.84IYY18 pKa = 11.01LGRR21 pKa = 11.84FAVYY25 pKa = 10.55VDD27 pKa = 3.3GVYY30 pKa = 10.18IGIYY34 pKa = 9.94DD35 pKa = 3.69VYY37 pKa = 11.51LEE39 pKa = 4.22VV40 pKa = 4.27
MM1 pKa = 7.59ILTSEE6 pKa = 4.67KK7 pKa = 9.97LTADD11 pKa = 3.61EE12 pKa = 4.77DD13 pKa = 3.81DD14 pKa = 3.31QRR16 pKa = 11.84IYY18 pKa = 11.01LGRR21 pKa = 11.84FAVYY25 pKa = 10.55VDD27 pKa = 3.3GVYY30 pKa = 10.18IGIYY34 pKa = 9.94DD35 pKa = 3.69VYY37 pKa = 11.51LEE39 pKa = 4.22VV40 pKa = 4.27
Molecular weight: 4.65 kDa
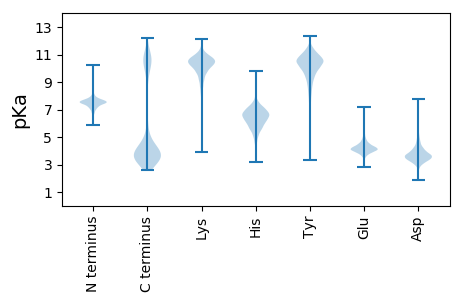
Isoelectric point according different methods:
Protein with the highest isoelectric point:
>tr|A0A1M5K2K5|A0A1M5K2K5_9FLAO 50S ribosomal protein L6 OS=Flavobacterium micromati OX=229205 GN=rplF PE=3 SV=1
MM1 pKa = 7.54SVRR4 pKa = 11.84KK5 pKa = 9.68LKK7 pKa = 10.5PITPGQRR14 pKa = 11.84FRR16 pKa = 11.84VVNGYY21 pKa = 9.53DD22 pKa = 4.32AITTDD27 pKa = 3.14KK28 pKa = 10.95PEE30 pKa = 4.34RR31 pKa = 11.84SLIAPIKK38 pKa = 10.47NSGGRR43 pKa = 11.84NSQGKK48 pKa = 6.33MTMRR52 pKa = 11.84YY53 pKa = 7.39TGGGHH58 pKa = 4.86KK59 pKa = 9.44QRR61 pKa = 11.84YY62 pKa = 8.74RR63 pKa = 11.84IIDD66 pKa = 3.78FKK68 pKa = 10.31RR69 pKa = 11.84TKK71 pKa = 10.12EE72 pKa = 4.27GIPATVKK79 pKa = 10.68SIEE82 pKa = 4.0YY83 pKa = 10.15DD84 pKa = 3.43PNRR87 pKa = 11.84TAFIALLAYY96 pKa = 10.31ADD98 pKa = 3.96GEE100 pKa = 4.24KK101 pKa = 10.14TYY103 pKa = 10.54IIAQNGLKK111 pKa = 10.25VGQKK115 pKa = 9.86LVSGPEE121 pKa = 3.92SQPEE125 pKa = 3.92IGNTLPLSKK134 pKa = 10.79VPLGTVISCIEE145 pKa = 3.9LRR147 pKa = 11.84PGQGAVIARR156 pKa = 11.84SAGTFAQLMARR167 pKa = 11.84DD168 pKa = 4.06GKK170 pKa = 10.75YY171 pKa = 9.05ATIKK175 pKa = 9.6MPSGEE180 pKa = 4.18TRR182 pKa = 11.84LILLTCSATIGAVSNSDD199 pKa = 3.15HH200 pKa = 6.2QLVVSGKK207 pKa = 9.63AGRR210 pKa = 11.84SRR212 pKa = 11.84WLGRR216 pKa = 11.84RR217 pKa = 11.84PRR219 pKa = 11.84TRR221 pKa = 11.84PVAMNPVDD229 pKa = 3.63HH230 pKa = 7.13PMGGGEE236 pKa = 4.08GRR238 pKa = 11.84SSGGHH243 pKa = 4.7PRR245 pKa = 11.84SRR247 pKa = 11.84NGIPAKK253 pKa = 10.29GYY255 pKa = 7.29RR256 pKa = 11.84TRR258 pKa = 11.84SKK260 pKa = 10.85KK261 pKa = 10.4NPSNKK266 pKa = 10.11YY267 pKa = 8.41IVEE270 pKa = 4.07RR271 pKa = 11.84RR272 pKa = 11.84KK273 pKa = 10.24KK274 pKa = 10.1
MM1 pKa = 7.54SVRR4 pKa = 11.84KK5 pKa = 9.68LKK7 pKa = 10.5PITPGQRR14 pKa = 11.84FRR16 pKa = 11.84VVNGYY21 pKa = 9.53DD22 pKa = 4.32AITTDD27 pKa = 3.14KK28 pKa = 10.95PEE30 pKa = 4.34RR31 pKa = 11.84SLIAPIKK38 pKa = 10.47NSGGRR43 pKa = 11.84NSQGKK48 pKa = 6.33MTMRR52 pKa = 11.84YY53 pKa = 7.39TGGGHH58 pKa = 4.86KK59 pKa = 9.44QRR61 pKa = 11.84YY62 pKa = 8.74RR63 pKa = 11.84IIDD66 pKa = 3.78FKK68 pKa = 10.31RR69 pKa = 11.84TKK71 pKa = 10.12EE72 pKa = 4.27GIPATVKK79 pKa = 10.68SIEE82 pKa = 4.0YY83 pKa = 10.15DD84 pKa = 3.43PNRR87 pKa = 11.84TAFIALLAYY96 pKa = 10.31ADD98 pKa = 3.96GEE100 pKa = 4.24KK101 pKa = 10.14TYY103 pKa = 10.54IIAQNGLKK111 pKa = 10.25VGQKK115 pKa = 9.86LVSGPEE121 pKa = 3.92SQPEE125 pKa = 3.92IGNTLPLSKK134 pKa = 10.79VPLGTVISCIEE145 pKa = 3.9LRR147 pKa = 11.84PGQGAVIARR156 pKa = 11.84SAGTFAQLMARR167 pKa = 11.84DD168 pKa = 4.06GKK170 pKa = 10.75YY171 pKa = 9.05ATIKK175 pKa = 9.6MPSGEE180 pKa = 4.18TRR182 pKa = 11.84LILLTCSATIGAVSNSDD199 pKa = 3.15HH200 pKa = 6.2QLVVSGKK207 pKa = 9.63AGRR210 pKa = 11.84SRR212 pKa = 11.84WLGRR216 pKa = 11.84RR217 pKa = 11.84PRR219 pKa = 11.84TRR221 pKa = 11.84PVAMNPVDD229 pKa = 3.63HH230 pKa = 7.13PMGGGEE236 pKa = 4.08GRR238 pKa = 11.84SSGGHH243 pKa = 4.7PRR245 pKa = 11.84SRR247 pKa = 11.84NGIPAKK253 pKa = 10.29GYY255 pKa = 7.29RR256 pKa = 11.84TRR258 pKa = 11.84SKK260 pKa = 10.85KK261 pKa = 10.4NPSNKK266 pKa = 10.11YY267 pKa = 8.41IVEE270 pKa = 4.07RR271 pKa = 11.84RR272 pKa = 11.84KK273 pKa = 10.24KK274 pKa = 10.1
Molecular weight: 29.82 kDa
Isoelectric point according different methods:
Peptides (in silico digests for buttom-up proteomics)
Below you can find in silico digests of the whole proteome with Trypsin, Chymotrypsin, Trypsin+LysC, LysN, ArgC proteases suitable for different mass spec machines.| Try ESI |
 |
|---|
| ChTry ESI |
|
|---|
| ArgC ESI |
|
|---|
| LysN ESI |
|
|---|
| TryLysC ESI |
|
|---|
| Try MALDI |
|
|---|
| ChTry MALDI |
|
|---|
| ArgC MALDI |
|
|---|
| LysN MALDI |
|
|---|
| TryLysC MALDI |
|
|---|
| Try LTQ |
|
|---|
| ChTry LTQ |
|
|---|
| ArgC LTQ |
|
|---|
| LysN LTQ |
|
|---|
| TryLysC LTQ |
|
|---|
| Try MSlow |
|
|---|
| ChTry MSlow |
|
|---|
| ArgC MSlow |
|
|---|
| LysN MSlow |
|
|---|
| TryLysC MSlow |
|
|---|
| Try MShigh |
|
|---|
| ChTry MShigh |
|
|---|
| ArgC MShigh |
|
|---|
| LysN MShigh |
|
|---|
| TryLysC MShigh |
|
|---|
General Statistics
Number of major isoforms |
Number of additional isoforms |
Number of all proteins |
Number of amino acids |
Min. Seq. Length |
Max. Seq. Length |
Avg. Seq. Length |
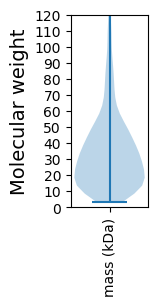
Avg. Mol. Weight |
|---|---|---|---|---|---|---|---|
0 |
1040682 |
29 |
4779 |
324.8 |
36.62 |
Amino acid frequency
Ala |
Cys |
Asp |
Glu |
Phe |
Gly |
His |
Ile |
Lys |
Leu |
|---|---|---|---|---|---|---|---|---|---|
6.529 ± 0.048 | 0.753 ± 0.014 |
5.258 ± 0.031 | 6.298 ± 0.048 |
5.471 ± 0.038 | 6.107 ± 0.041 |
1.6 ± 0.018 | 8.644 ± 0.039 |
8.064 ± 0.062 | 9.298 ± 0.05 |
Met |
Asn |
Gln |
Pro |
Arg |
Ser |
Thr |
Val |
Trp |
Tyr |
|---|---|---|---|---|---|---|---|---|---|
2.223 ± 0.023 | 6.454 ± 0.041 |
3.256 ± 0.028 | 3.472 ± 0.025 |
3.216 ± 0.031 | 6.534 ± 0.033 |
5.839 ± 0.069 | 6.144 ± 0.039 |
0.956 ± 0.017 | 3.885 ± 0.03 |
Most of the basic statistics you can see at this page can be downloaded from this CSV file
See this proteome in:

Proteome-pI is available under Creative Commons Attribution-NoDerivs license, for more details see here
| Reference: Kozlowski LP. Proteome-pI 2.0: Proteome Isoelectric Point Database Update. Nucleic Acids Res. 2021, doi: 10.1093/nar/gkab944 | Contact: Lukasz P. Kozlowski |