Candidatus Enterovibrio escacola
Taxonomy: cellular organisms; Bacteria; Proteobacteria; Gammaproteobacteria; Vibrionales; Vibrionaceae; Enterovibrio
Average proteome isoelectric point is 7.3
Get precalculated fractions of proteins
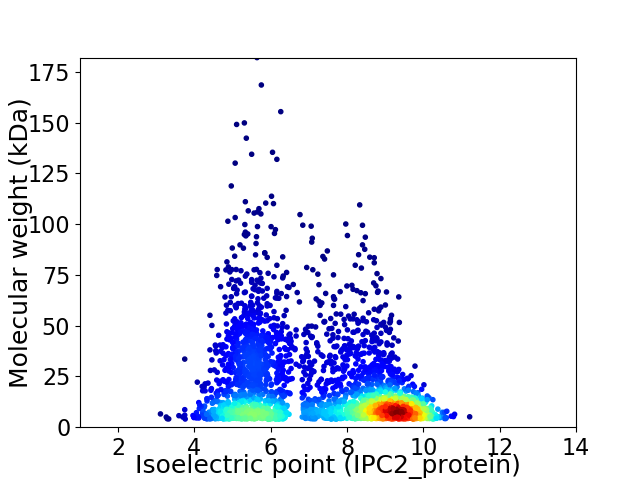
Virtual 2D-PAGE plot for 3193 proteins (isoelectric point calculated using IPC2_protein)
Get csv file with sequences according to given criteria:
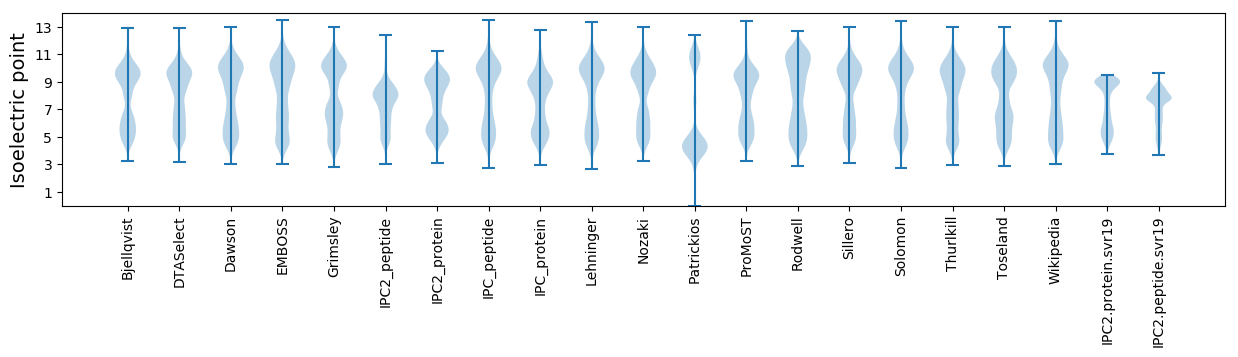
* You can choose from 21 different methods for calculating isoelectric point
Summary statistics related to proteome-wise predictions
Protein with the lowest isoelectric point:
>tr|A0A2A5T0S9|A0A2A5T0S9_9GAMM Mobile element protein OS=Candidatus Enterovibrio escacola OX=1927127 GN=BTN49_2742 PE=4 SV=1
MM1 pKa = 8.19DD2 pKa = 5.91DD3 pKa = 4.12KK4 pKa = 11.54LYY6 pKa = 10.64LPVVIGVDD14 pKa = 3.07NTSYY18 pKa = 11.29KK19 pKa = 10.46EE20 pKa = 3.82VLAVVDD26 pKa = 5.15GYY28 pKa = 11.23RR29 pKa = 11.84EE30 pKa = 4.36SEE32 pKa = 4.4VSWLEE37 pKa = 3.74VLSQLTCQDD46 pKa = 3.33INISPP51 pKa = 3.88
MM1 pKa = 8.19DD2 pKa = 5.91DD3 pKa = 4.12KK4 pKa = 11.54LYY6 pKa = 10.64LPVVIGVDD14 pKa = 3.07NTSYY18 pKa = 11.29KK19 pKa = 10.46EE20 pKa = 3.82VLAVVDD26 pKa = 5.15GYY28 pKa = 11.23RR29 pKa = 11.84EE30 pKa = 4.36SEE32 pKa = 4.4VSWLEE37 pKa = 3.74VLSQLTCQDD46 pKa = 3.33INISPP51 pKa = 3.88
Molecular weight: 5.75 kDa
Isoelectric point according different methods:
Protein with the highest isoelectric point:
>tr|A0A2A5T542|A0A2A5T542_9GAMM RNA polymerase sigma factor RpoH OS=Candidatus Enterovibrio escacola OX=1927127 GN=rpoH PE=3 SV=1
MM1 pKa = 7.45KK2 pKa = 9.51RR3 pKa = 11.84TFQPSVLKK11 pKa = 10.49RR12 pKa = 11.84KK13 pKa = 7.97RR14 pKa = 11.84THH16 pKa = 5.89GFRR19 pKa = 11.84ARR21 pKa = 11.84MATKK25 pKa = 9.99GGRR28 pKa = 11.84RR29 pKa = 11.84VIAARR34 pKa = 11.84RR35 pKa = 11.84AKK37 pKa = 10.14GRR39 pKa = 11.84KK40 pKa = 8.23QLSKK44 pKa = 11.23
MM1 pKa = 7.45KK2 pKa = 9.51RR3 pKa = 11.84TFQPSVLKK11 pKa = 10.49RR12 pKa = 11.84KK13 pKa = 7.97RR14 pKa = 11.84THH16 pKa = 5.89GFRR19 pKa = 11.84ARR21 pKa = 11.84MATKK25 pKa = 9.99GGRR28 pKa = 11.84RR29 pKa = 11.84VIAARR34 pKa = 11.84RR35 pKa = 11.84AKK37 pKa = 10.14GRR39 pKa = 11.84KK40 pKa = 8.23QLSKK44 pKa = 11.23
Molecular weight: 5.12 kDa
Isoelectric point according different methods:
Peptides (in silico digests for buttom-up proteomics)
Below you can find in silico digests of the whole proteome with Trypsin, Chymotrypsin, Trypsin+LysC, LysN, ArgC proteases suitable for different mass spec machines.| Try ESI |
 |
|---|
| ChTry ESI |
|
|---|
| ArgC ESI |
|
|---|
| LysN ESI |
|
|---|
| TryLysC ESI |
|
|---|
| Try MALDI |
|
|---|
| ChTry MALDI |
|
|---|
| ArgC MALDI |
|
|---|
| LysN MALDI |
|
|---|
| TryLysC MALDI |
|
|---|
| Try LTQ |
|
|---|
| ChTry LTQ |
|
|---|
| ArgC LTQ |
|
|---|
| LysN LTQ |
|
|---|
| TryLysC LTQ |
|
|---|
| Try MSlow |
|
|---|
| ChTry MSlow |
|
|---|
| ArgC MSlow |
|
|---|
| LysN MSlow |
|
|---|
| TryLysC MSlow |
|
|---|
| Try MShigh |
|
|---|
| ChTry MShigh |
|
|---|
| ArgC MShigh |
|
|---|
| LysN MShigh |
|
|---|
| TryLysC MShigh |
|
|---|
General Statistics
Number of major isoforms |
Number of additional isoforms |
Number of all proteins |
Number of amino acids |
Min. Seq. Length |
Max. Seq. Length |
Avg. Seq. Length |
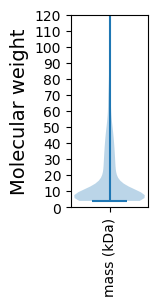
Avg. Mol. Weight |
|---|---|---|---|---|---|---|---|
0 |
536259 |
37 |
1605 |
167.9 |
18.92 |
Amino acid frequency
Ala |
Cys |
Asp |
Glu |
Phe |
Gly |
His |
Ile |
Lys |
Leu |
|---|---|---|---|---|---|---|---|---|---|
6.643 ± 0.052 | 1.328 ± 0.019 |
5.162 ± 0.038 | 5.76 ± 0.049 |
4.203 ± 0.036 | 6.372 ± 0.054 |
2.455 ± 0.025 | 7.498 ± 0.043 |
6.305 ± 0.048 | 10.303 ± 0.063 |
Met |
Asn |
Gln |
Pro |
Arg |
Ser |
Thr |
Val |
Trp |
Tyr |
|---|---|---|---|---|---|---|---|---|---|
3.07 ± 0.025 | 4.633 ± 0.033 |
3.531 ± 0.029 | 3.779 ± 0.034 |
5.254 ± 0.039 | 6.582 ± 0.044 |
5.499 ± 0.033 | 7.221 ± 0.043 |
1.159 ± 0.02 | 3.243 ± 0.032 |
Most of the basic statistics you can see at this page can be downloaded from this CSV file
See this proteome in:

Proteome-pI is available under Creative Commons Attribution-NoDerivs license, for more details see here
| Reference: Kozlowski LP. Proteome-pI 2.0: Proteome Isoelectric Point Database Update. Nucleic Acids Res. 2021, doi: 10.1093/nar/gkab944 | Contact: Lukasz P. Kozlowski |