Streptococcus phage IPP64
Taxonomy: Viruses; Duplodnaviria; Heunggongvirae; Uroviricota; Caudoviricetes; Caudovirales; Siphoviridae; unclassified Siphoviridae
Average proteome isoelectric point is 6.05
Get precalculated fractions of proteins
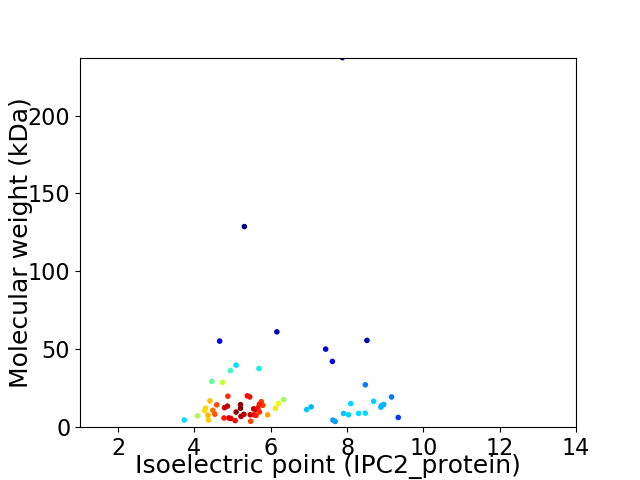
Virtual 2D-PAGE plot for 67 proteins (isoelectric point calculated using IPC2_protein)
Get csv file with sequences according to given criteria:
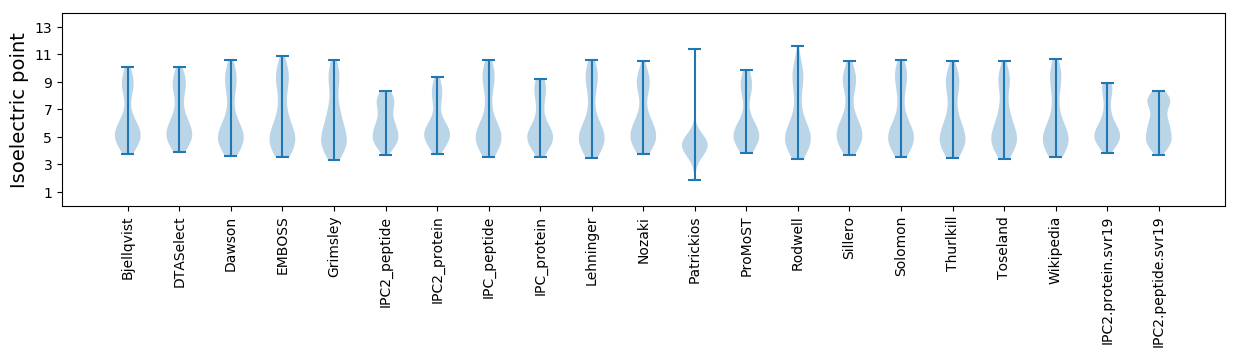
* You can choose from 21 different methods for calculating isoelectric point
Summary statistics related to proteome-wise predictions
Protein with the lowest isoelectric point:
>tr|A0A1S5SFF2|A0A1S5SFF2_9CAUD Uncharacterized protein OS=Streptococcus phage IPP64 OX=1916200 GN=IPP64_00002 PE=4 SV=1
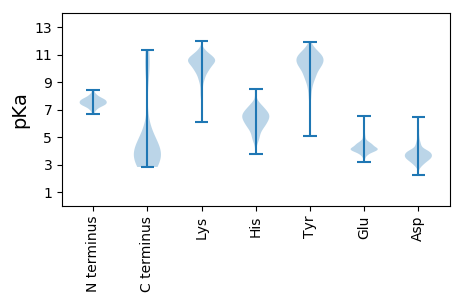
MM1 pKa = 8.39LMFNYY6 pKa = 10.01DD7 pKa = 3.94RR8 pKa = 11.84DD9 pKa = 3.49IMQPPEE15 pKa = 3.98EE16 pKa = 4.61RR17 pKa = 11.84EE18 pKa = 4.03EE19 pKa = 4.62LDD21 pKa = 3.41PADD24 pKa = 4.33WIFSAGQWIYY34 pKa = 11.59VGDD37 pKa = 4.05CC38 pKa = 3.39
MM1 pKa = 8.39LMFNYY6 pKa = 10.01DD7 pKa = 3.94RR8 pKa = 11.84DD9 pKa = 3.49IMQPPEE15 pKa = 3.98EE16 pKa = 4.61RR17 pKa = 11.84EE18 pKa = 4.03EE19 pKa = 4.62LDD21 pKa = 3.41PADD24 pKa = 4.33WIFSAGQWIYY34 pKa = 11.59VGDD37 pKa = 4.05CC38 pKa = 3.39
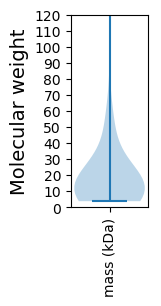
Molecular weight: 4.58 kDa
Isoelectric point according different methods:
Protein with the highest isoelectric point:
>tr|A0A1S5SFK0|A0A1S5SFK0_9CAUD Putative head morphogenesis protein OS=Streptococcus phage IPP64 OX=1916200 GN=IPP64_00043 PE=4 SV=1
MM1 pKa = 7.55FIWDD5 pKa = 3.59WVSIAFGWLVFLLLIFIIMAVISGIIKK32 pKa = 9.8GVKK35 pKa = 9.76KK36 pKa = 9.73GTEE39 pKa = 3.21KK40 pKa = 10.25WKK42 pKa = 10.77NGKK45 pKa = 9.27KK46 pKa = 9.92DD47 pKa = 3.61LKK49 pKa = 11.23KK50 pKa = 10.1NTTNN54 pKa = 3.39
MM1 pKa = 7.55FIWDD5 pKa = 3.59WVSIAFGWLVFLLLIFIIMAVISGIIKK32 pKa = 9.8GVKK35 pKa = 9.76KK36 pKa = 9.73GTEE39 pKa = 3.21KK40 pKa = 10.25WKK42 pKa = 10.77NGKK45 pKa = 9.27KK46 pKa = 9.92DD47 pKa = 3.61LKK49 pKa = 11.23KK50 pKa = 10.1NTTNN54 pKa = 3.39
Molecular weight: 6.24 kDa
Isoelectric point according different methods:
Peptides (in silico digests for buttom-up proteomics)
Below you can find in silico digests of the whole proteome with Trypsin, Chymotrypsin, Trypsin+LysC, LysN, ArgC proteases suitable for different mass spec machines.| Try ESI |
 |
|---|
| ChTry ESI |
|
|---|
| ArgC ESI |
|
|---|
| LysN ESI |
|
|---|
| TryLysC ESI |
|
|---|
| Try MALDI |
|
|---|
| ChTry MALDI |
|
|---|
| ArgC MALDI |
|
|---|
| LysN MALDI |
|
|---|
| TryLysC MALDI |
|
|---|
| Try LTQ |
|
|---|
| ChTry LTQ |
|
|---|
| ArgC LTQ |
|
|---|
| LysN LTQ |
|
|---|
| TryLysC LTQ |
|
|---|
| Try MSlow |
|
|---|
| ChTry MSlow |
|
|---|
| ArgC MSlow |
|
|---|
| LysN MSlow |
|
|---|
| TryLysC MSlow |
|
|---|
| Try MShigh |
|
|---|
| ChTry MShigh |
|
|---|
| ArgC MShigh |
|
|---|
| LysN MShigh |
|
|---|
| TryLysC MShigh |
|
|---|
General Statistics
Number of major isoforms |
Number of additional isoforms |
Number of all proteins |
Number of amino acids |
Min. Seq. Length |
Max. Seq. Length |
Avg. Seq. Length |
Avg. Mol. Weight |
|---|---|---|---|---|---|---|---|
0 |
12541 |
32 |
2124 |
187.2 |
21.24 |
Amino acid frequency
Ala |
Cys |
Asp |
Glu |
Phe |
Gly |
His |
Ile |
Lys |
Leu |
|---|---|---|---|---|---|---|---|---|---|
6.834 ± 0.587 | 0.67 ± 0.114 |
6.483 ± 0.286 | 8.101 ± 0.496 |
4.194 ± 0.226 | 6.57 ± 0.516 |
1.372 ± 0.188 | 6.507 ± 0.328 |
8.133 ± 0.361 | 8.141 ± 0.248 |
Met |
Asn |
Gln |
Pro |
Arg |
Ser |
Thr |
Val |
Trp |
Tyr |
|---|---|---|---|---|---|---|---|---|---|
2.4 ± 0.23 | 5.35 ± 0.235 |
2.544 ± 0.221 | 4.282 ± 0.277 |
4.88 ± 0.308 | 6.044 ± 0.356 |
6.044 ± 0.382 | 6.443 ± 0.222 |
1.372 ± 0.142 | 3.636 ± 0.308 |
Most of the basic statistics you can see at this page can be downloaded from this CSV file
See this proteome in:

Proteome-pI is available under Creative Commons Attribution-NoDerivs license, for more details see here
| Reference: Kozlowski LP. Proteome-pI 2.0: Proteome Isoelectric Point Database Update. Nucleic Acids Res. 2021, doi: 10.1093/nar/gkab944 | Contact: Lukasz P. Kozlowski |