Bacillus taxi
Taxonomy: cellular organisms; Bacteria; Terrabacteria group; Firmicutes; Bacilli; Bacillales; Bacillaceae; Niallia
Average proteome isoelectric point is 6.31
Get precalculated fractions of proteins
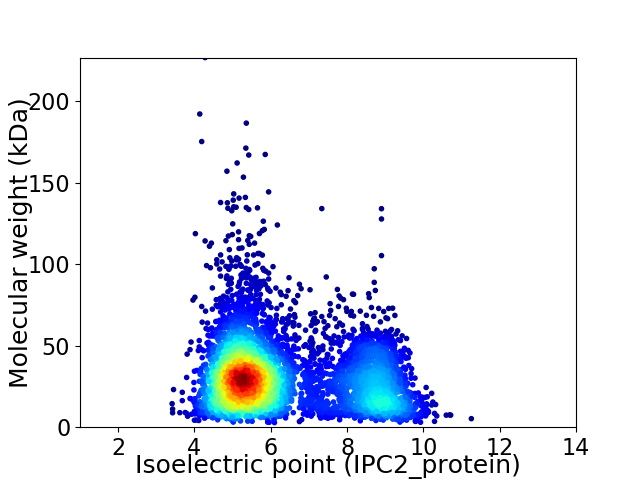
Virtual 2D-PAGE plot for 5402 proteins (isoelectric point calculated using IPC2_protein)
Get csv file with sequences according to given criteria:
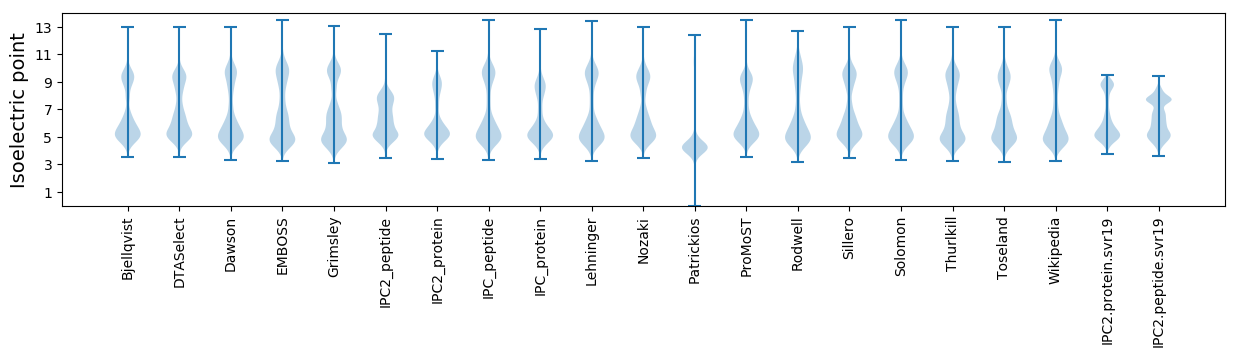
* You can choose from 21 different methods for calculating isoelectric point
Summary statistics related to proteome-wise predictions
Protein with the lowest isoelectric point:
>tr|A0A3S2TV05|A0A3S2TV05_9BACI Malate dehydrogenase OS=Bacillus taxi OX=2499688 GN=mdh PE=3 SV=1
MM1 pKa = 7.94PIALQAFTNTANTVRR16 pKa = 11.84IADD19 pKa = 3.84SATAPGPVVTVGPQIPLVDD38 pKa = 4.25GNSSYY43 pKa = 10.38IWSPVSVSGQTVTFRR58 pKa = 11.84SVFSLGAPLLGIALPLTVFYY78 pKa = 10.4AYY80 pKa = 10.37AGNEE84 pKa = 4.35TVSVTGTLQVLDD96 pKa = 3.77VLGVIVLTIPLFSGDD111 pKa = 3.84TNLGNPLNVSTIAADD126 pKa = 3.71TLLAASILGGTINITIDD143 pKa = 3.44AVVTAPITTPYY154 pKa = 10.57EE155 pKa = 3.85PVNTGRR161 pKa = 11.84YY162 pKa = 8.69LGEE165 pKa = 3.84ITVQTIVV172 pKa = 3.09
MM1 pKa = 7.94PIALQAFTNTANTVRR16 pKa = 11.84IADD19 pKa = 3.84SATAPGPVVTVGPQIPLVDD38 pKa = 4.25GNSSYY43 pKa = 10.38IWSPVSVSGQTVTFRR58 pKa = 11.84SVFSLGAPLLGIALPLTVFYY78 pKa = 10.4AYY80 pKa = 10.37AGNEE84 pKa = 4.35TVSVTGTLQVLDD96 pKa = 3.77VLGVIVLTIPLFSGDD111 pKa = 3.84TNLGNPLNVSTIAADD126 pKa = 3.71TLLAASILGGTINITIDD143 pKa = 3.44AVVTAPITTPYY154 pKa = 10.57EE155 pKa = 3.85PVNTGRR161 pKa = 11.84YY162 pKa = 8.69LGEE165 pKa = 3.84ITVQTIVV172 pKa = 3.09
Molecular weight: 17.64 kDa
Isoelectric point according different methods:
Protein with the highest isoelectric point:
>tr|A0A3S2X3A1|A0A3S2X3A1_9BACI Alcohol dehydrogenase OS=Bacillus taxi OX=2499688 GN=EM808_12390 PE=3 SV=1
MM1 pKa = 7.44KK2 pKa = 9.59RR3 pKa = 11.84TFQPNKK9 pKa = 8.24RR10 pKa = 11.84KK11 pKa = 9.6RR12 pKa = 11.84SKK14 pKa = 9.59VHH16 pKa = 5.83GFRR19 pKa = 11.84SRR21 pKa = 11.84MSSPNGRR28 pKa = 11.84NVLARR33 pKa = 11.84RR34 pKa = 11.84RR35 pKa = 11.84RR36 pKa = 11.84KK37 pKa = 9.05GRR39 pKa = 11.84KK40 pKa = 8.7VLSAA44 pKa = 4.05
MM1 pKa = 7.44KK2 pKa = 9.59RR3 pKa = 11.84TFQPNKK9 pKa = 8.24RR10 pKa = 11.84KK11 pKa = 9.6RR12 pKa = 11.84SKK14 pKa = 9.59VHH16 pKa = 5.83GFRR19 pKa = 11.84SRR21 pKa = 11.84MSSPNGRR28 pKa = 11.84NVLARR33 pKa = 11.84RR34 pKa = 11.84RR35 pKa = 11.84RR36 pKa = 11.84KK37 pKa = 9.05GRR39 pKa = 11.84KK40 pKa = 8.7VLSAA44 pKa = 4.05
Molecular weight: 5.24 kDa
Isoelectric point according different methods:
Peptides (in silico digests for buttom-up proteomics)
Below you can find in silico digests of the whole proteome with Trypsin, Chymotrypsin, Trypsin+LysC, LysN, ArgC proteases suitable for different mass spec machines.| Try ESI |
 |
|---|
| ChTry ESI |
|
|---|
| ArgC ESI |
|
|---|
| LysN ESI |
|
|---|
| TryLysC ESI |
|
|---|
| Try MALDI |
|
|---|
| ChTry MALDI |
|
|---|
| ArgC MALDI |
|
|---|
| LysN MALDI |
|
|---|
| TryLysC MALDI |
|
|---|
| Try LTQ |
|
|---|
| ChTry LTQ |
|
|---|
| ArgC LTQ |
|
|---|
| LysN LTQ |
|
|---|
| TryLysC LTQ |
|
|---|
| Try MSlow |
|
|---|
| ChTry MSlow |
|
|---|
| ArgC MSlow |
|
|---|
| LysN MSlow |
|
|---|
| TryLysC MSlow |
|
|---|
| Try MShigh |
|
|---|
| ChTry MShigh |
|
|---|
| ArgC MShigh |
|
|---|
| LysN MShigh |
|
|---|
| TryLysC MShigh |
|
|---|
General Statistics
Number of major isoforms |
Number of additional isoforms |
Number of all proteins |
Number of amino acids |
Min. Seq. Length |
Max. Seq. Length |
Avg. Seq. Length |
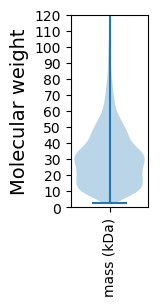
Avg. Mol. Weight |
|---|---|---|---|---|---|---|---|
0 |
1569371 |
26 |
2055 |
290.5 |
32.6 |
Amino acid frequency
Ala |
Cys |
Asp |
Glu |
Phe |
Gly |
His |
Ile |
Lys |
Leu |
|---|---|---|---|---|---|---|---|---|---|
7.097 ± 0.037 | 0.709 ± 0.01 |
5.085 ± 0.032 | 7.342 ± 0.038 |
4.579 ± 0.029 | 6.691 ± 0.032 |
1.944 ± 0.017 | 8.193 ± 0.03 |
7.237 ± 0.033 | 9.867 ± 0.034 |
Met |
Asn |
Gln |
Pro |
Arg |
Ser |
Thr |
Val |
Trp |
Tyr |
|---|---|---|---|---|---|---|---|---|---|
2.714 ± 0.017 | 4.765 ± 0.028 |
3.351 ± 0.02 | 3.553 ± 0.021 |
3.61 ± 0.025 | 6.337 ± 0.027 |
5.472 ± 0.027 | 6.725 ± 0.029 |
1.038 ± 0.012 | 3.692 ± 0.021 |
Most of the basic statistics you can see at this page can be downloaded from this CSV file
See this proteome in:

Proteome-pI is available under Creative Commons Attribution-NoDerivs license, for more details see here
| Reference: Kozlowski LP. Proteome-pI 2.0: Proteome Isoelectric Point Database Update. Nucleic Acids Res. 2021, doi: 10.1093/nar/gkab944 | Contact: Lukasz P. Kozlowski |