Bacillus phage YungSlug
Taxonomy: Viruses; Duplodnaviria; Heunggongvirae; Uroviricota; Caudoviricetes; Caudovirales; Herelleviridae; Spounavirinae; unclassified Spounavirinae
Average proteome isoelectric point is 6.35
Get precalculated fractions of proteins
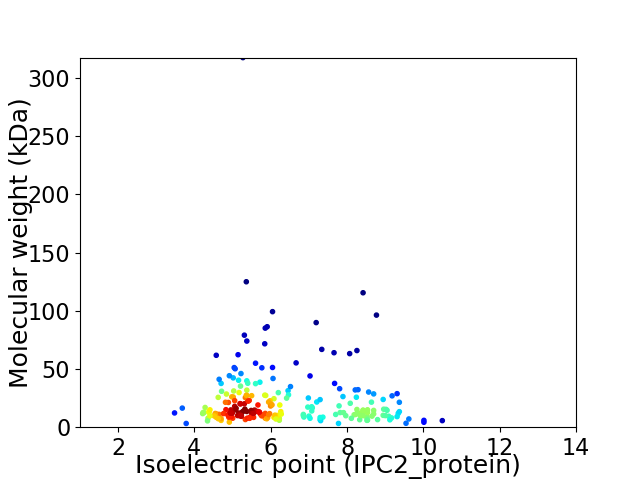
Virtual 2D-PAGE plot for 227 proteins (isoelectric point calculated using IPC2_protein)
Get csv file with sequences according to given criteria:
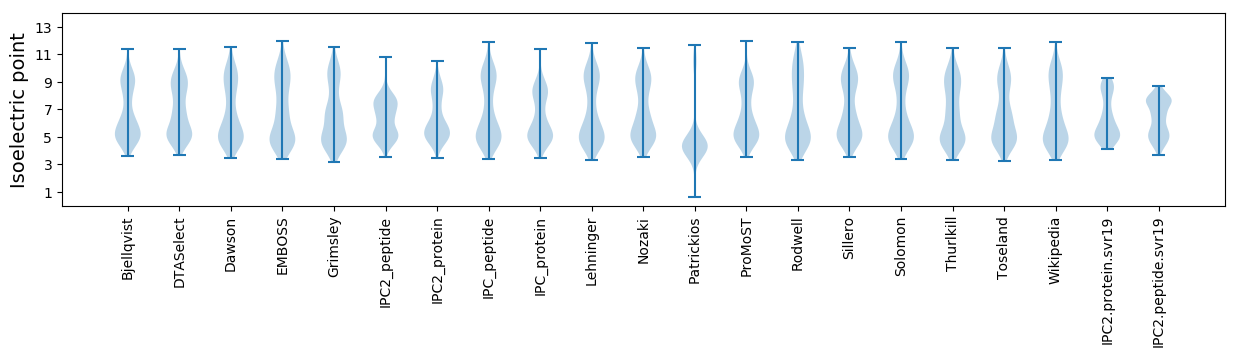
* You can choose from 21 different methods for calculating isoelectric point
Summary statistics related to proteome-wise predictions
Protein with the lowest isoelectric point:
>tr|A0A7D3V2R0|A0A7D3V2R0_9CAUD Uncharacterized protein OS=Bacillus phage YungSlug OX=2736257 GN=YUNGSLUG_12 PE=4 SV=1
MM1 pKa = 7.35IAWFLFVVGFVFAITLLGNNNTWFLHH27 pKa = 5.17FCSAVGMLFFVIGYY41 pKa = 9.72LKK43 pKa = 10.82DD44 pKa = 3.58SDD46 pKa = 4.53LMTTIWPIFIPFMFFSIITNLFWEE70 pKa = 4.9EE71 pKa = 3.91VV72 pKa = 3.38
MM1 pKa = 7.35IAWFLFVVGFVFAITLLGNNNTWFLHH27 pKa = 5.17FCSAVGMLFFVIGYY41 pKa = 9.72LKK43 pKa = 10.82DD44 pKa = 3.58SDD46 pKa = 4.53LMTTIWPIFIPFMFFSIITNLFWEE70 pKa = 4.9EE71 pKa = 3.91VV72 pKa = 3.38
Molecular weight: 8.49 kDa
Isoelectric point according different methods:
Protein with the highest isoelectric point:
>tr|A0A7D3QRD3|A0A7D3QRD3_9CAUD Uncharacterized protein OS=Bacillus phage YungSlug OX=2736257 GN=YUNGSLUG_164 PE=4 SV=1
MM1 pKa = 7.17MSYY4 pKa = 10.04FYY6 pKa = 10.31RR7 pKa = 11.84QKK9 pKa = 10.43EE10 pKa = 3.79RR11 pKa = 11.84AGRR14 pKa = 11.84FSSPPPITQEE24 pKa = 4.51RR25 pKa = 11.84IAKK28 pKa = 7.0TKK30 pKa = 10.99NKK32 pKa = 9.65IQVGG36 pKa = 3.76
MM1 pKa = 7.17MSYY4 pKa = 10.04FYY6 pKa = 10.31RR7 pKa = 11.84QKK9 pKa = 10.43EE10 pKa = 3.79RR11 pKa = 11.84AGRR14 pKa = 11.84FSSPPPITQEE24 pKa = 4.51RR25 pKa = 11.84IAKK28 pKa = 7.0TKK30 pKa = 10.99NKK32 pKa = 9.65IQVGG36 pKa = 3.76
Molecular weight: 4.24 kDa
Isoelectric point according different methods:
Peptides (in silico digests for buttom-up proteomics)
Below you can find in silico digests of the whole proteome with Trypsin, Chymotrypsin, Trypsin+LysC, LysN, ArgC proteases suitable for different mass spec machines.| Try ESI |
 |
|---|
| ChTry ESI |
|
|---|
| ArgC ESI |
|
|---|
| LysN ESI |
|
|---|
| TryLysC ESI |
|
|---|
| Try MALDI |
|
|---|
| ChTry MALDI |
|
|---|
| ArgC MALDI |
|
|---|
| LysN MALDI |
|
|---|
| TryLysC MALDI |
|
|---|
| Try LTQ |
|
|---|
| ChTry LTQ |
|
|---|
| ArgC LTQ |
|
|---|
| LysN LTQ |
|
|---|
| TryLysC LTQ |
|
|---|
| Try MSlow |
|
|---|
| ChTry MSlow |
|
|---|
| ArgC MSlow |
|
|---|
| LysN MSlow |
|
|---|
| TryLysC MSlow |
|
|---|
| Try MShigh |
|
|---|
| ChTry MShigh |
|
|---|
| ArgC MShigh |
|
|---|
| LysN MShigh |
|
|---|
| TryLysC MShigh |
|
|---|
General Statistics
Number of major isoforms |
Number of additional isoforms |
Number of all proteins |
Number of amino acids |
Min. Seq. Length |
Max. Seq. Length |
Avg. Seq. Length |
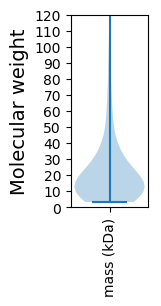
Avg. Mol. Weight |
|---|---|---|---|---|---|---|---|
0 |
46458 |
29 |
2883 |
204.7 |
23.32 |
Amino acid frequency
Ala |
Cys |
Asp |
Glu |
Phe |
Gly |
His |
Ile |
Lys |
Leu |
|---|---|---|---|---|---|---|---|---|---|
5.917 ± 0.197 | 0.902 ± 0.078 |
6.249 ± 0.135 | 8.681 ± 0.33 |
4.219 ± 0.124 | 6.729 ± 0.264 |
1.649 ± 0.095 | 6.042 ± 0.126 |
9.46 ± 0.285 | 8.007 ± 0.152 |
Met |
Asn |
Gln |
Pro |
Arg |
Ser |
Thr |
Val |
Trp |
Tyr |
|---|---|---|---|---|---|---|---|---|---|
2.962 ± 0.114 | 5.351 ± 0.144 |
3.188 ± 0.13 | 3.181 ± 0.111 |
4.314 ± 0.139 | 5.284 ± 0.157 |
5.794 ± 0.279 | 6.836 ± 0.166 |
1.367 ± 0.073 | 3.868 ± 0.102 |
Most of the basic statistics you can see at this page can be downloaded from this CSV file
See this proteome in:

Proteome-pI is available under Creative Commons Attribution-NoDerivs license, for more details see here
| Reference: Kozlowski LP. Proteome-pI 2.0: Proteome Isoelectric Point Database Update. Nucleic Acids Res. 2021, doi: 10.1093/nar/gkab944 | Contact: Lukasz P. Kozlowski |