Burkholderia phage KS14
Taxonomy: Viruses; Duplodnaviria; Heunggongvirae; Uroviricota; Caudoviricetes; Caudovirales; Myoviridae; Peduovirinae; Kisquattuordecimvirus; Burkholderia virus KS14
Average proteome isoelectric point is 6.6
Get precalculated fractions of proteins
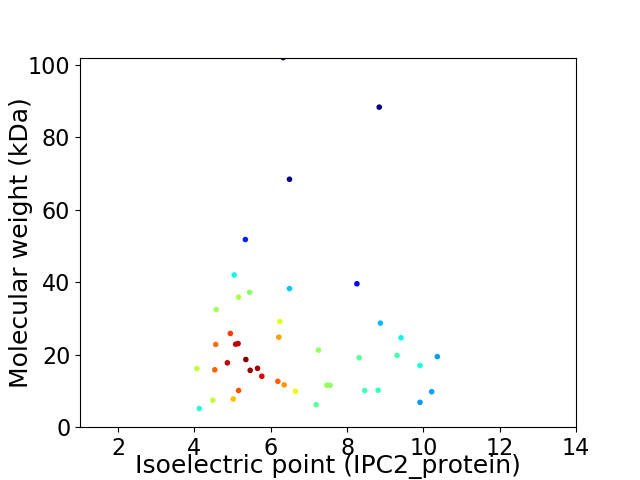
Virtual 2D-PAGE plot for 44 proteins (isoelectric point calculated using IPC2_protein)
Get csv file with sequences according to given criteria:
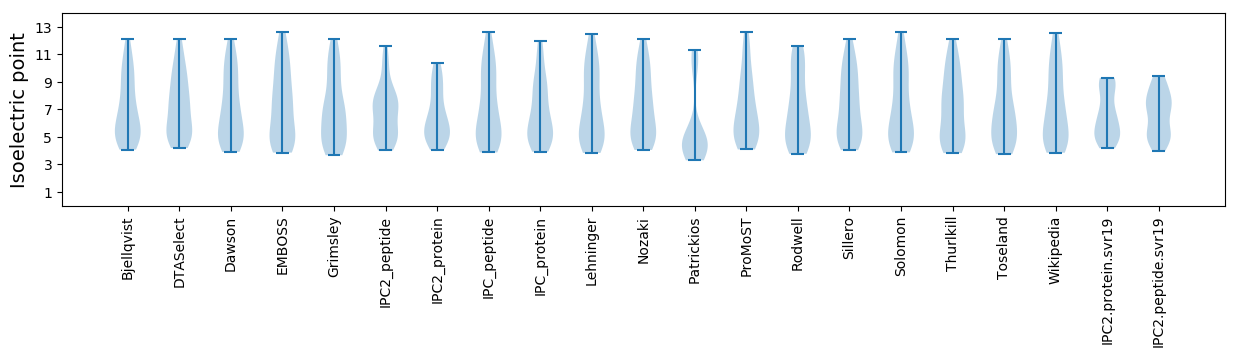
* You can choose from 21 different methods for calculating isoelectric point
Summary statistics related to proteome-wise predictions
Protein with the lowest isoelectric point:
>tr|E5FFJ6|E5FFJ6_9CAUD Gp43 OS=Burkholderia phage KS14 OX=910475 GN=43 PE=4 SV=1
MM1 pKa = 7.38RR2 pKa = 11.84VAAVVLIFAALEE14 pKa = 4.05IACASAWGVIADD26 pKa = 5.03ASDD29 pKa = 3.18TCQIDD34 pKa = 3.51DD35 pKa = 4.08EE36 pKa = 5.02KK37 pKa = 11.18ICVEE41 pKa = 4.2SIGWLEE47 pKa = 3.81RR48 pKa = 3.58
MM1 pKa = 7.38RR2 pKa = 11.84VAAVVLIFAALEE14 pKa = 4.05IACASAWGVIADD26 pKa = 5.03ASDD29 pKa = 3.18TCQIDD34 pKa = 3.51DD35 pKa = 4.08EE36 pKa = 5.02KK37 pKa = 11.18ICVEE41 pKa = 4.2SIGWLEE47 pKa = 3.81RR48 pKa = 3.58
Molecular weight: 5.15 kDa
Isoelectric point according different methods:
Protein with the highest isoelectric point:
>tr|E5FFF8|E5FFF8_9CAUD Gp5 OS=Burkholderia phage KS14 OX=910475 GN=5 PE=4 SV=1
MM1 pKa = 7.45RR2 pKa = 11.84TMTSRR7 pKa = 11.84TSPAKK12 pKa = 9.86RR13 pKa = 11.84VPIPLSAEE21 pKa = 4.01QIDD24 pKa = 3.87NLQRR28 pKa = 11.84LAKK31 pKa = 9.89QEE33 pKa = 4.01QRR35 pKa = 11.84SEE37 pKa = 3.87AQMARR42 pKa = 11.84IIYY45 pKa = 9.85LVGLEE50 pKa = 4.11QYY52 pKa = 10.04SSKK55 pKa = 10.62VKK57 pKa = 10.46RR58 pKa = 11.84RR59 pKa = 3.4
MM1 pKa = 7.45RR2 pKa = 11.84TMTSRR7 pKa = 11.84TSPAKK12 pKa = 9.86RR13 pKa = 11.84VPIPLSAEE21 pKa = 4.01QIDD24 pKa = 3.87NLQRR28 pKa = 11.84LAKK31 pKa = 9.89QEE33 pKa = 4.01QRR35 pKa = 11.84SEE37 pKa = 3.87AQMARR42 pKa = 11.84IIYY45 pKa = 9.85LVGLEE50 pKa = 4.11QYY52 pKa = 10.04SSKK55 pKa = 10.62VKK57 pKa = 10.46RR58 pKa = 11.84RR59 pKa = 3.4
Molecular weight: 6.86 kDa
Isoelectric point according different methods:
Peptides (in silico digests for buttom-up proteomics)
Below you can find in silico digests of the whole proteome with Trypsin, Chymotrypsin, Trypsin+LysC, LysN, ArgC proteases suitable for different mass spec machines.| Try ESI |
 |
|---|
| ChTry ESI |
|
|---|
| ArgC ESI |
|
|---|
| LysN ESI |
|
|---|
| TryLysC ESI |
|
|---|
| Try MALDI |
|
|---|
| ChTry MALDI |
|
|---|
| ArgC MALDI |
|
|---|
| LysN MALDI |
|
|---|
| TryLysC MALDI |
|
|---|
| Try LTQ |
|
|---|
| ChTry LTQ |
|
|---|
| ArgC LTQ |
|
|---|
| LysN LTQ |
|
|---|
| TryLysC LTQ |
|
|---|
| Try MSlow |
|
|---|
| ChTry MSlow |
|
|---|
| ArgC MSlow |
|
|---|
| LysN MSlow |
|
|---|
| TryLysC MSlow |
|
|---|
| Try MShigh |
|
|---|
| ChTry MShigh |
|
|---|
| ArgC MShigh |
|
|---|
| LysN MShigh |
|
|---|
| TryLysC MShigh |
|
|---|
General Statistics
Number of major isoforms |
Number of additional isoforms |
Number of all proteins |
Number of amino acids |
Min. Seq. Length |
Max. Seq. Length |
Avg. Seq. Length |
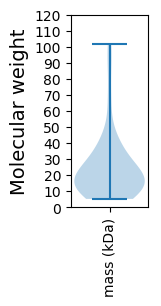
Avg. Mol. Weight |
|---|---|---|---|---|---|---|---|
0 |
9937 |
48 |
923 |
225.8 |
24.55 |
Amino acid frequency
Ala |
Cys |
Asp |
Glu |
Phe |
Gly |
His |
Ile |
Lys |
Leu |
|---|---|---|---|---|---|---|---|---|---|
14.038 ± 0.663 | 0.765 ± 0.141 |
6.219 ± 0.299 | 5.676 ± 0.265 |
3.18 ± 0.221 | 7.668 ± 0.467 |
1.982 ± 0.232 | 4.871 ± 0.136 |
4.478 ± 0.297 | 8.876 ± 0.223 |
Met |
Asn |
Gln |
Pro |
Arg |
Ser |
Thr |
Val |
Trp |
Tyr |
|---|---|---|---|---|---|---|---|---|---|
2.556 ± 0.207 | 3.009 ± 0.169 |
4.287 ± 0.246 | 3.432 ± 0.205 |
7.135 ± 0.425 | 5.515 ± 0.215 |
6.229 ± 0.302 | 6.34 ± 0.216 |
1.338 ± 0.143 | 2.405 ± 0.201 |
Most of the basic statistics you can see at this page can be downloaded from this CSV file
See this proteome in:

Proteome-pI is available under Creative Commons Attribution-NoDerivs license, for more details see here
| Reference: Kozlowski LP. Proteome-pI 2.0: Proteome Isoelectric Point Database Update. Nucleic Acids Res. 2021, doi: 10.1093/nar/gkab944 | Contact: Lukasz P. Kozlowski |