Bacillus phage vB_BboS-125
Taxonomy: Viruses; Duplodnaviria; Heunggongvirae; Uroviricota; Caudoviricetes; Caudovirales; Myoviridae; Elmenteitavirus; Bacillus virus 125
Average proteome isoelectric point is 6.59
Get precalculated fractions of proteins
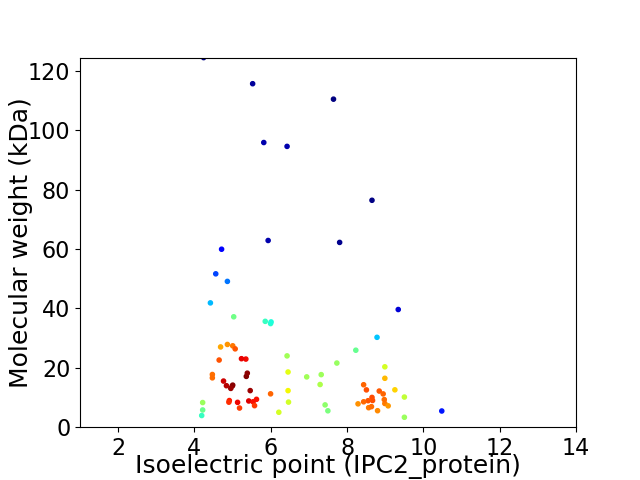
Virtual 2D-PAGE plot for 80 proteins (isoelectric point calculated using IPC2_protein)
Get csv file with sequences according to given criteria:
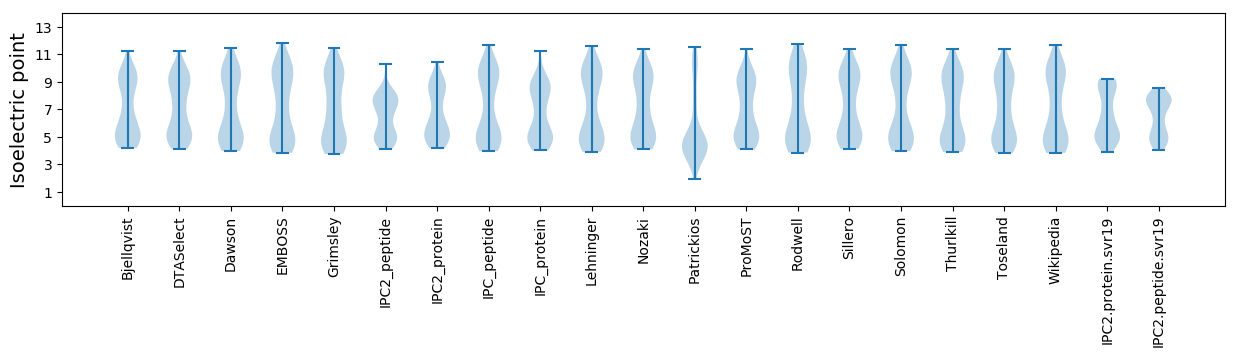
* You can choose from 21 different methods for calculating isoelectric point
Summary statistics related to proteome-wise predictions
Protein with the lowest isoelectric point:
>tr|A0A3G3BVW9|A0A3G3BVW9_9CAUD AP2 domain protein OS=Bacillus phage vB_BboS-125 OX=2419618 GN=BboS125_00033 PE=4 SV=1
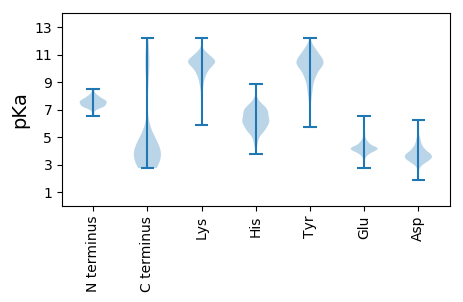
MM1 pKa = 7.9DD2 pKa = 3.89KK3 pKa = 10.91CEE5 pKa = 3.9RR6 pKa = 11.84CEE8 pKa = 3.83EE9 pKa = 4.15VTRR12 pKa = 11.84ITVTSNGVYY21 pKa = 9.96VCNDD25 pKa = 2.88CWIDD29 pKa = 4.05GDD31 pKa = 4.77DD32 pKa = 4.56KK33 pKa = 11.45EE34 pKa = 4.43
MM1 pKa = 7.9DD2 pKa = 3.89KK3 pKa = 10.91CEE5 pKa = 3.9RR6 pKa = 11.84CEE8 pKa = 3.83EE9 pKa = 4.15VTRR12 pKa = 11.84ITVTSNGVYY21 pKa = 9.96VCNDD25 pKa = 2.88CWIDD29 pKa = 4.05GDD31 pKa = 4.77DD32 pKa = 4.56KK33 pKa = 11.45EE34 pKa = 4.43
Molecular weight: 3.93 kDa
Isoelectric point according different methods:
Protein with the highest isoelectric point:
>tr|A0A3G3BVV0|A0A3G3BVV0_9CAUD Uncharacterized protein OS=Bacillus phage vB_BboS-125 OX=2419618 GN=BboS125_00019 PE=4 SV=1
MM1 pKa = 7.12SWKK4 pKa = 10.76SMLYY8 pKa = 10.87KK9 pKa = 9.51MLKK12 pKa = 9.83YY13 pKa = 10.88SNDD16 pKa = 3.02YY17 pKa = 10.79NAIKK21 pKa = 9.93KK22 pKa = 9.92GKK24 pKa = 7.61VGRR27 pKa = 11.84RR28 pKa = 11.84IGRR31 pKa = 11.84RR32 pKa = 11.84VAGKK36 pKa = 8.83ATGRR40 pKa = 11.84LFGKK44 pKa = 9.93LFKK47 pKa = 10.87
MM1 pKa = 7.12SWKK4 pKa = 10.76SMLYY8 pKa = 10.87KK9 pKa = 9.51MLKK12 pKa = 9.83YY13 pKa = 10.88SNDD16 pKa = 3.02YY17 pKa = 10.79NAIKK21 pKa = 9.93KK22 pKa = 9.92GKK24 pKa = 7.61VGRR27 pKa = 11.84RR28 pKa = 11.84IGRR31 pKa = 11.84RR32 pKa = 11.84VAGKK36 pKa = 8.83ATGRR40 pKa = 11.84LFGKK44 pKa = 9.93LFKK47 pKa = 10.87
Molecular weight: 5.45 kDa
Isoelectric point according different methods:
Peptides (in silico digests for buttom-up proteomics)
Below you can find in silico digests of the whole proteome with Trypsin, Chymotrypsin, Trypsin+LysC, LysN, ArgC proteases suitable for different mass spec machines.| Try ESI |
 |
|---|
| ChTry ESI |
|
|---|
| ArgC ESI |
|
|---|
| LysN ESI |
|
|---|
| TryLysC ESI |
|
|---|
| Try MALDI |
|
|---|
| ChTry MALDI |
|
|---|
| ArgC MALDI |
|
|---|
| LysN MALDI |
|
|---|
| TryLysC MALDI |
|
|---|
| Try LTQ |
|
|---|
| ChTry LTQ |
|
|---|
| ArgC LTQ |
|
|---|
| LysN LTQ |
|
|---|
| TryLysC LTQ |
|
|---|
| Try MSlow |
|
|---|
| ChTry MSlow |
|
|---|
| ArgC MSlow |
|
|---|
| LysN MSlow |
|
|---|
| TryLysC MSlow |
|
|---|
| Try MShigh |
|
|---|
| ChTry MShigh |
|
|---|
| ArgC MShigh |
|
|---|
| LysN MShigh |
|
|---|
| TryLysC MShigh |
|
|---|
General Statistics
Number of major isoforms |
Number of additional isoforms |
Number of all proteins |
Number of amino acids |
Min. Seq. Length |
Max. Seq. Length |
Avg. Seq. Length |
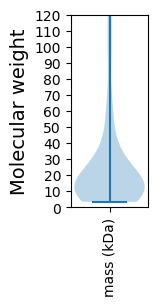
Avg. Mol. Weight |
|---|---|---|---|---|---|---|---|
0 |
17592 |
30 |
1178 |
219.9 |
24.59 |
Amino acid frequency
Ala |
Cys |
Asp |
Glu |
Phe |
Gly |
His |
Ile |
Lys |
Leu |
|---|---|---|---|---|---|---|---|---|---|
9.436 ± 0.382 | 0.483 ± 0.107 |
5.906 ± 0.221 | 8.072 ± 0.337 |
3.223 ± 0.219 | 7.663 ± 0.288 |
1.467 ± 0.149 | 5.52 ± 0.24 |
7.452 ± 0.479 | 8.544 ± 0.255 |
Met |
Asn |
Gln |
Pro |
Arg |
Ser |
Thr |
Val |
Trp |
Tyr |
|---|---|---|---|---|---|---|---|---|---|
2.183 ± 0.214 | 4.127 ± 0.205 |
3.757 ± 0.192 | 4.718 ± 0.218 |
5.275 ± 0.316 | 4.269 ± 0.325 |
5.883 ± 0.304 | 6.799 ± 0.213 |
1.336 ± 0.1 | 3.888 ± 0.225 |
Most of the basic statistics you can see at this page can be downloaded from this CSV file
See this proteome in:

Proteome-pI is available under Creative Commons Attribution-NoDerivs license, for more details see here
| Reference: Kozlowski LP. Proteome-pI 2.0: Proteome Isoelectric Point Database Update. Nucleic Acids Res. 2021, doi: 10.1093/nar/gkab944 | Contact: Lukasz P. Kozlowski |