Chitinophaga extrema
Taxonomy: cellular organisms; Bacteria; FCB group;
Average proteome isoelectric point is 6.96
Get precalculated fractions of proteins
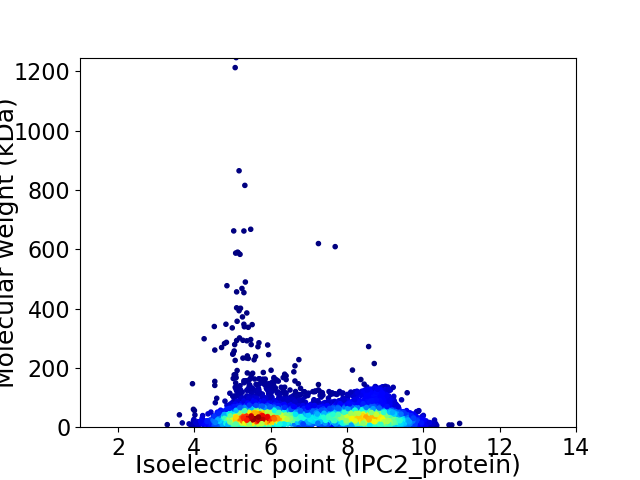
Virtual 2D-PAGE plot for 5973 proteins (isoelectric point calculated using IPC2_protein)
Get csv file with sequences according to given criteria:
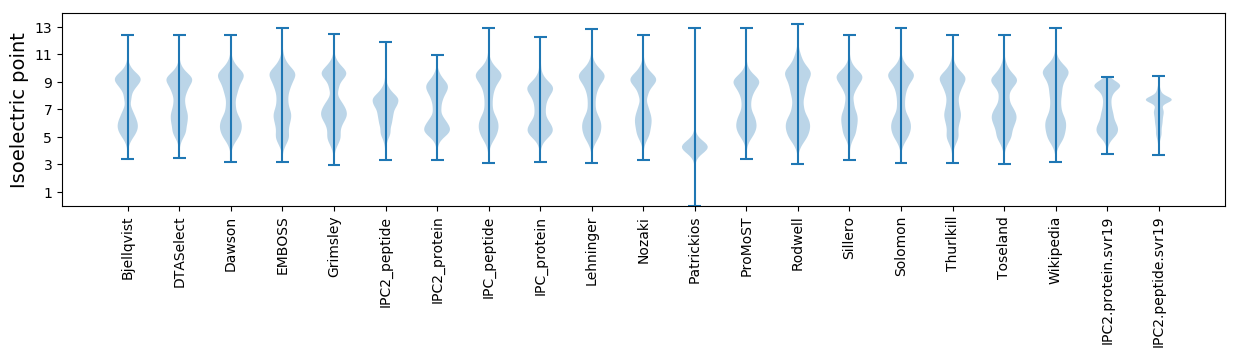
* You can choose from 21 different methods for calculating isoelectric point
Summary statistics related to proteome-wise predictions
Protein with the lowest isoelectric point:
>tr|A0A3S1B478|A0A3S1B478_9BACT FtsX-like permease family protein OS=Chitinophaga extrema OX=2485489 GN=ECE50_02535 PE=4 SV=1
MM1 pKa = 7.59ALLVVTFLRR10 pKa = 11.84VDD12 pKa = 4.65FPAVAFLVVDD22 pKa = 4.75FLAVDD27 pKa = 4.15LAEE30 pKa = 4.29VARR33 pKa = 11.84LAVAFLAVAFLAVVFLAVDD52 pKa = 3.89FLAVVFLAVDD62 pKa = 3.94FFAAAFLAAAFFGTLTPSLRR82 pKa = 11.84ASDD85 pKa = 3.93NPIAIACLGLVTFFPFLPLFSLPSCISCITFSTFSCDD122 pKa = 3.12FLEE125 pKa = 4.53YY126 pKa = 10.2FAITEE131 pKa = 4.26DD132 pKa = 4.15LNGG135 pKa = 3.5
MM1 pKa = 7.59ALLVVTFLRR10 pKa = 11.84VDD12 pKa = 4.65FPAVAFLVVDD22 pKa = 4.75FLAVDD27 pKa = 4.15LAEE30 pKa = 4.29VARR33 pKa = 11.84LAVAFLAVAFLAVVFLAVDD52 pKa = 3.89FLAVVFLAVDD62 pKa = 3.94FFAAAFLAAAFFGTLTPSLRR82 pKa = 11.84ASDD85 pKa = 3.93NPIAIACLGLVTFFPFLPLFSLPSCISCITFSTFSCDD122 pKa = 3.12FLEE125 pKa = 4.53YY126 pKa = 10.2FAITEE131 pKa = 4.26DD132 pKa = 4.15LNGG135 pKa = 3.5
Molecular weight: 14.49 kDa
Isoelectric point according different methods:
Protein with the highest isoelectric point:
>tr|A0A3S1AX72|A0A3S1AX72_9BACT Uncharacterized protein OS=Chitinophaga extrema OX=2485489 GN=ECE50_26125 PE=4 SV=1
MM1 pKa = 7.42SVINCAVTAGLNSPDD16 pKa = 2.82RR17 pKa = 11.84RR18 pKa = 11.84ARR20 pKa = 11.84RR21 pKa = 11.84GVQGNWCHH29 pKa = 6.19KK30 pKa = 10.0GKK32 pKa = 10.92YY33 pKa = 8.76PVLNLFSRR41 pKa = 11.84KK42 pKa = 8.95PFSRR46 pKa = 11.84RR47 pKa = 11.84ADD49 pKa = 3.3QVIQADD55 pKa = 4.15VPVLSLSCC63 pKa = 4.3
MM1 pKa = 7.42SVINCAVTAGLNSPDD16 pKa = 2.82RR17 pKa = 11.84RR18 pKa = 11.84ARR20 pKa = 11.84RR21 pKa = 11.84GVQGNWCHH29 pKa = 6.19KK30 pKa = 10.0GKK32 pKa = 10.92YY33 pKa = 8.76PVLNLFSRR41 pKa = 11.84KK42 pKa = 8.95PFSRR46 pKa = 11.84RR47 pKa = 11.84ADD49 pKa = 3.3QVIQADD55 pKa = 4.15VPVLSLSCC63 pKa = 4.3
Molecular weight: 6.99 kDa
Isoelectric point according different methods:
Peptides (in silico digests for buttom-up proteomics)
Below you can find in silico digests of the whole proteome with Trypsin, Chymotrypsin, Trypsin+LysC, LysN, ArgC proteases suitable for different mass spec machines.| Try ESI |
 |
|---|
| ChTry ESI |
|
|---|
| ArgC ESI |
|
|---|
| LysN ESI |
|
|---|
| TryLysC ESI |
|
|---|
| Try MALDI |
|
|---|
| ChTry MALDI |
|
|---|
| ArgC MALDI |
|
|---|
| LysN MALDI |
|
|---|
| TryLysC MALDI |
|
|---|
| Try LTQ |
|
|---|
| ChTry LTQ |
|
|---|
| ArgC LTQ |
|
|---|
| LysN LTQ |
|
|---|
| TryLysC LTQ |
|
|---|
| Try MSlow |
|
|---|
| ChTry MSlow |
|
|---|
| ArgC MSlow |
|
|---|
| LysN MSlow |
|
|---|
| TryLysC MSlow |
|
|---|
| Try MShigh |
|
|---|
| ChTry MShigh |
|
|---|
| ArgC MShigh |
|
|---|
| LysN MShigh |
|
|---|
| TryLysC MShigh |
|
|---|
General Statistics
Number of major isoforms |
Number of additional isoforms |
Number of all proteins |
Number of amino acids |
Min. Seq. Length |
Max. Seq. Length |
Avg. Seq. Length |
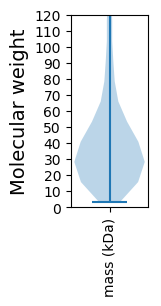
Avg. Mol. Weight |
|---|---|---|---|---|---|---|---|
0 |
2372467 |
26 |
11197 |
397.2 |
44.34 |
Amino acid frequency
Ala |
Cys |
Asp |
Glu |
Phe |
Gly |
His |
Ile |
Lys |
Leu |
|---|---|---|---|---|---|---|---|---|---|
8.581 ± 0.033 | 0.872 ± 0.013 |
5.138 ± 0.021 | 5.267 ± 0.035 |
4.481 ± 0.023 | 7.056 ± 0.034 |
2.105 ± 0.018 | 6.509 ± 0.024 |
5.519 ± 0.039 | 9.685 ± 0.044 |
Met |
Asn |
Gln |
Pro |
Arg |
Ser |
Thr |
Val |
Trp |
Tyr |
|---|---|---|---|---|---|---|---|---|---|
2.433 ± 0.017 | 4.889 ± 0.032 |
4.38 ± 0.022 | 4.263 ± 0.024 |
4.81 ± 0.023 | 6.041 ± 0.022 |
6.124 ± 0.038 | 6.402 ± 0.026 |
1.29 ± 0.011 | 4.154 ± 0.022 |
Most of the basic statistics you can see at this page can be downloaded from this CSV file
See this proteome in:

Proteome-pI is available under Creative Commons Attribution-NoDerivs license, for more details see here
| Reference: Kozlowski LP. Proteome-pI 2.0: Proteome Isoelectric Point Database Update. Nucleic Acids Res. 2021, doi: 10.1093/nar/gkab944 | Contact: Lukasz P. Kozlowski |