Elusimicrobium minutum (strain Pei191)
Taxonomy: cellular organisms; Bacteria; Elusimicrobia; Elusimicrobia; Elusimicrobiales; Elusimicrobiaceae; Elusimicrobium; Elusimicrobium minutum
Average proteome isoelectric point is 7.36
Get precalculated fractions of proteins
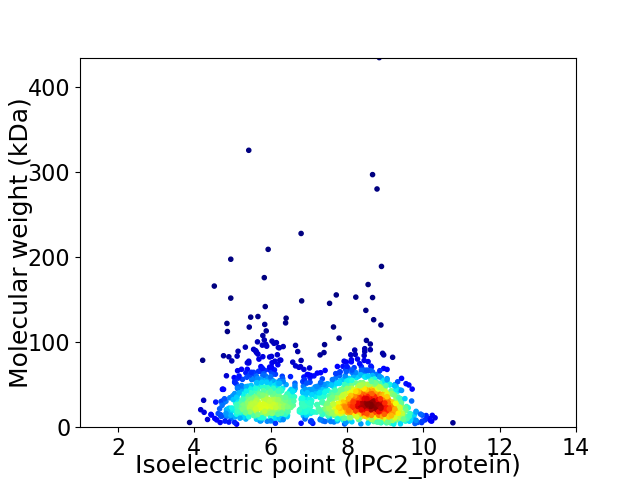
Virtual 2D-PAGE plot for 1528 proteins (isoelectric point calculated using IPC2_protein)
Get csv file with sequences according to given criteria:
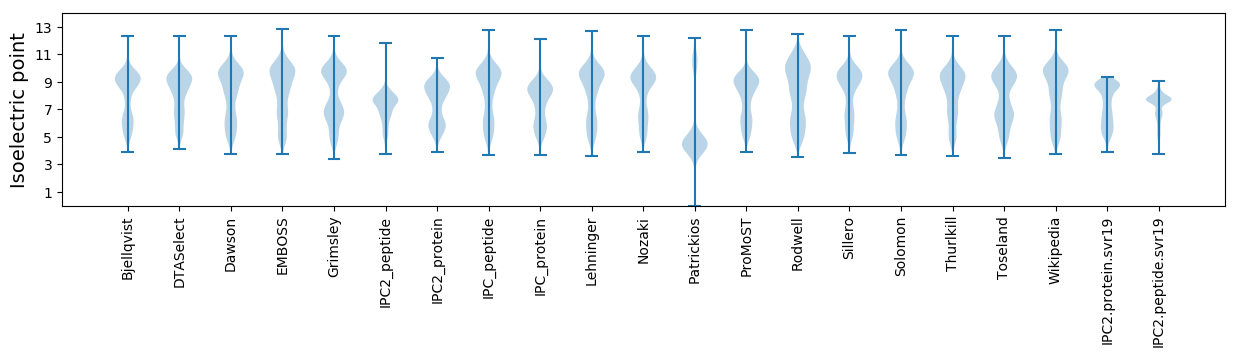
* You can choose from 21 different methods for calculating isoelectric point
Summary statistics related to proteome-wise predictions
Protein with the lowest isoelectric point:
>tr|B2KAP3|B2KAP3_ELUMP Glycoside hydrolase OS=Elusimicrobium minutum (strain Pei191) OX=445932 GN=Emin_0021 PE=4 SV=1
MM1 pKa = 7.15QKK3 pKa = 10.23YY4 pKa = 8.61VCNVCGYY11 pKa = 9.82IYY13 pKa = 10.52DD14 pKa = 4.32PAAGDD19 pKa = 3.82PDD21 pKa = 3.96SGITAGTPWEE31 pKa = 4.2QVPADD36 pKa = 4.27WVCPACGVGKK46 pKa = 9.99DD47 pKa = 3.72QFSPMM52 pKa = 4.05
MM1 pKa = 7.15QKK3 pKa = 10.23YY4 pKa = 8.61VCNVCGYY11 pKa = 9.82IYY13 pKa = 10.52DD14 pKa = 4.32PAAGDD19 pKa = 3.82PDD21 pKa = 3.96SGITAGTPWEE31 pKa = 4.2QVPADD36 pKa = 4.27WVCPACGVGKK46 pKa = 9.99DD47 pKa = 3.72QFSPMM52 pKa = 4.05
Molecular weight: 5.54 kDa
Isoelectric point according different methods:
Protein with the highest isoelectric point:
>tr|B2KEM7|B2KEM7_ELUMP Elongation factor G OS=Elusimicrobium minutum (strain Pei191) OX=445932 GN=fusA PE=3 SV=1
MM1 pKa = 7.12ATKK4 pKa = 10.36AWVAKK9 pKa = 8.15MAKK12 pKa = 7.89PQKK15 pKa = 10.1FAVRR19 pKa = 11.84YY20 pKa = 8.95HH21 pKa = 6.02NRR23 pKa = 11.84CQVCGRR29 pKa = 11.84PRR31 pKa = 11.84GYY33 pKa = 10.88YY34 pKa = 9.61RR35 pKa = 11.84DD36 pKa = 3.92FGLCRR41 pKa = 11.84ICLRR45 pKa = 11.84KK46 pKa = 8.66MAHH49 pKa = 5.98QGLIPGVRR57 pKa = 11.84KK58 pKa = 10.39SSWW61 pKa = 2.83
MM1 pKa = 7.12ATKK4 pKa = 10.36AWVAKK9 pKa = 8.15MAKK12 pKa = 7.89PQKK15 pKa = 10.1FAVRR19 pKa = 11.84YY20 pKa = 8.95HH21 pKa = 6.02NRR23 pKa = 11.84CQVCGRR29 pKa = 11.84PRR31 pKa = 11.84GYY33 pKa = 10.88YY34 pKa = 9.61RR35 pKa = 11.84DD36 pKa = 3.92FGLCRR41 pKa = 11.84ICLRR45 pKa = 11.84KK46 pKa = 8.66MAHH49 pKa = 5.98QGLIPGVRR57 pKa = 11.84KK58 pKa = 10.39SSWW61 pKa = 2.83
Molecular weight: 7.13 kDa
Isoelectric point according different methods:
Peptides (in silico digests for buttom-up proteomics)
Below you can find in silico digests of the whole proteome with Trypsin, Chymotrypsin, Trypsin+LysC, LysN, ArgC proteases suitable for different mass spec machines.| Try ESI |
 |
|---|
| ChTry ESI |
|
|---|
| ArgC ESI |
|
|---|
| LysN ESI |
|
|---|
| TryLysC ESI |
|
|---|
| Try MALDI |
|
|---|
| ChTry MALDI |
|
|---|
| ArgC MALDI |
|
|---|
| LysN MALDI |
|
|---|
| TryLysC MALDI |
|
|---|
| Try LTQ |
|
|---|
| ChTry LTQ |
|
|---|
| ArgC LTQ |
|
|---|
| LysN LTQ |
|
|---|
| TryLysC LTQ |
|
|---|
| Try MSlow |
|
|---|
| ChTry MSlow |
|
|---|
| ArgC MSlow |
|
|---|
| LysN MSlow |
|
|---|
| TryLysC MSlow |
|
|---|
| Try MShigh |
|
|---|
| ChTry MShigh |
|
|---|
| ArgC MShigh |
|
|---|
| LysN MShigh |
|
|---|
| TryLysC MShigh |
|
|---|
General Statistics
Number of major isoforms |
Number of additional isoforms |
Number of all proteins |
Number of amino acids |
Min. Seq. Length |
Max. Seq. Length |
Avg. Seq. Length |
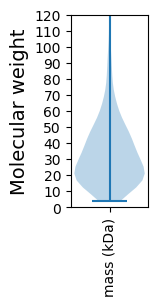
Avg. Mol. Weight |
|---|---|---|---|---|---|---|---|
0 |
493618 |
30 |
3965 |
323.0 |
35.95 |
Amino acid frequency
Ala |
Cys |
Asp |
Glu |
Phe |
Gly |
His |
Ile |
Lys |
Leu |
|---|---|---|---|---|---|---|---|---|---|
8.378 ± 0.06 | 1.19 ± 0.039 |
4.881 ± 0.047 | 6.441 ± 0.06 |
4.95 ± 0.058 | 6.944 ± 0.056 |
1.502 ± 0.024 | 7.543 ± 0.053 |
8.841 ± 0.065 | 9.085 ± 0.058 |
Met |
Asn |
Gln |
Pro |
Arg |
Ser |
Thr |
Val |
Trp |
Tyr |
|---|---|---|---|---|---|---|---|---|---|
2.446 ± 0.024 | 4.985 ± 0.049 |
3.704 ± 0.039 | 2.883 ± 0.033 |
3.708 ± 0.041 | 6.148 ± 0.052 |
5.344 ± 0.047 | 6.636 ± 0.047 |
0.838 ± 0.02 | 3.551 ± 0.037 |
Most of the basic statistics you can see at this page can be downloaded from this CSV file
See this proteome in:

Proteome-pI is available under Creative Commons Attribution-NoDerivs license, for more details see here
| Reference: Kozlowski LP. Proteome-pI 2.0: Proteome Isoelectric Point Database Update. Nucleic Acids Res. 2021, doi: 10.1093/nar/gkab944 | Contact: Lukasz P. Kozlowski |