Calderihabitans maritimus
Taxonomy: cellular organisms; Bacteria; Terrabacteria group; Firmicutes; Clostridia; Thermoanaerobacterales; Thermoanaerobacteraceae; Moorella group; Calderihabitans
Average proteome isoelectric point is 6.98
Get precalculated fractions of proteins
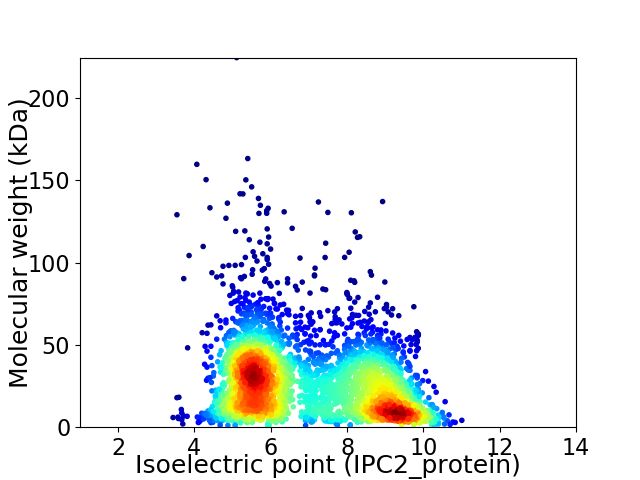
Virtual 2D-PAGE plot for 3537 proteins (isoelectric point calculated using IPC2_protein)
Get csv file with sequences according to given criteria:
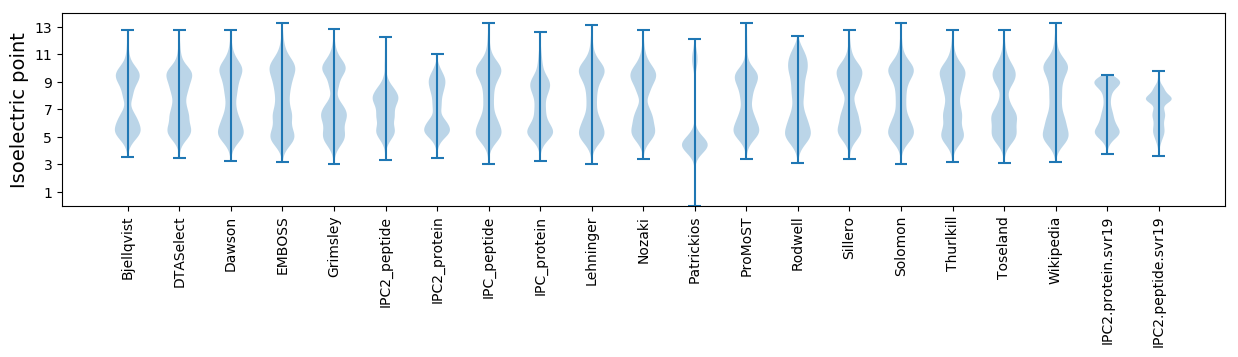
* You can choose from 21 different methods for calculating isoelectric point
Summary statistics related to proteome-wise predictions
Protein with the lowest isoelectric point:
>tr|A0A1Z5HR89|A0A1Z5HR89_9THEO Uncharacterized protein OS=Calderihabitans maritimus OX=1246530 GN=KKC1_11180 PE=3 SV=1
MM1 pKa = 7.27KK2 pKa = 10.61VKK4 pKa = 10.33VDD6 pKa = 3.53PDD8 pKa = 3.37EE9 pKa = 5.82CIEE12 pKa = 4.46CGACIATCPAVFDD25 pKa = 3.95WDD27 pKa = 4.46DD28 pKa = 3.33NGKK31 pKa = 9.25AHH33 pKa = 7.51AIVDD37 pKa = 3.88EE38 pKa = 4.47VPPEE42 pKa = 4.16EE43 pKa = 4.31EE44 pKa = 4.24DD45 pKa = 3.52AAHH48 pKa = 6.56EE49 pKa = 4.1AVEE52 pKa = 4.39GCPTDD57 pKa = 4.98AISEE61 pKa = 4.3EE62 pKa = 4.28
MM1 pKa = 7.27KK2 pKa = 10.61VKK4 pKa = 10.33VDD6 pKa = 3.53PDD8 pKa = 3.37EE9 pKa = 5.82CIEE12 pKa = 4.46CGACIATCPAVFDD25 pKa = 3.95WDD27 pKa = 4.46DD28 pKa = 3.33NGKK31 pKa = 9.25AHH33 pKa = 7.51AIVDD37 pKa = 3.88EE38 pKa = 4.47VPPEE42 pKa = 4.16EE43 pKa = 4.31EE44 pKa = 4.24DD45 pKa = 3.52AAHH48 pKa = 6.56EE49 pKa = 4.1AVEE52 pKa = 4.39GCPTDD57 pKa = 4.98AISEE61 pKa = 4.3EE62 pKa = 4.28
Molecular weight: 6.62 kDa
Isoelectric point according different methods:
Protein with the highest isoelectric point:
>tr|A0A1Z5HXI1|A0A1Z5HXI1_9THEO Signal peptidase I OS=Calderihabitans maritimus OX=1246530 GN=KKC1_33430 PE=3 SV=1
MM1 pKa = 7.19ITGQATLTRR10 pKa = 11.84LRR12 pKa = 11.84KK13 pKa = 9.67FIPRR17 pKa = 11.84FSRR20 pKa = 11.84IRR22 pKa = 11.84PTASASITIRR32 pKa = 11.84ASAQRR37 pKa = 3.53
MM1 pKa = 7.19ITGQATLTRR10 pKa = 11.84LRR12 pKa = 11.84KK13 pKa = 9.67FIPRR17 pKa = 11.84FSRR20 pKa = 11.84IRR22 pKa = 11.84PTASASITIRR32 pKa = 11.84ASAQRR37 pKa = 3.53
Molecular weight: 4.17 kDa
Isoelectric point according different methods:
Peptides (in silico digests for buttom-up proteomics)
Below you can find in silico digests of the whole proteome with Trypsin, Chymotrypsin, Trypsin+LysC, LysN, ArgC proteases suitable for different mass spec machines.| Try ESI |
 |
|---|
| ChTry ESI |
|
|---|
| ArgC ESI |
|
|---|
| LysN ESI |
|
|---|
| TryLysC ESI |
|
|---|
| Try MALDI |
|
|---|
| ChTry MALDI |
|
|---|
| ArgC MALDI |
|
|---|
| LysN MALDI |
|
|---|
| TryLysC MALDI |
|
|---|
| Try LTQ |
|
|---|
| ChTry LTQ |
|
|---|
| ArgC LTQ |
|
|---|
| LysN LTQ |
|
|---|
| TryLysC LTQ |
|
|---|
| Try MSlow |
|
|---|
| ChTry MSlow |
|
|---|
| ArgC MSlow |
|
|---|
| LysN MSlow |
|
|---|
| TryLysC MSlow |
|
|---|
| Try MShigh |
|
|---|
| ChTry MShigh |
|
|---|
| ArgC MShigh |
|
|---|
| LysN MShigh |
|
|---|
| TryLysC MShigh |
|
|---|
General Statistics
Number of major isoforms |
Number of additional isoforms |
Number of all proteins |
Number of amino acids |
Min. Seq. Length |
Max. Seq. Length |
Avg. Seq. Length |
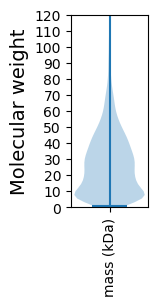
Avg. Mol. Weight |
|---|---|---|---|---|---|---|---|
909730 |
8 |
1961 |
257.2 |
28.7 |
Amino acid frequency
Ala |
Cys |
Asp |
Glu |
Phe |
Gly |
His |
Ile |
Lys |
Leu |
|---|---|---|---|---|---|---|---|---|---|
8.15 ± 0.048 | 1.124 ± 0.022 |
4.46 ± 0.032 | 7.713 ± 0.056 |
3.87 ± 0.03 | 7.782 ± 0.04 |
1.788 ± 0.019 | 6.795 ± 0.035 |
5.946 ± 0.045 | 10.544 ± 0.059 |
Met |
Asn |
Gln |
Pro |
Arg |
Ser |
Thr |
Val |
Trp |
Tyr |
|---|---|---|---|---|---|---|---|---|---|
2.406 ± 0.023 | 3.382 ± 0.025 |
4.399 ± 0.025 | 3.406 ± 0.027 |
6.133 ± 0.045 | 4.913 ± 0.032 |
4.818 ± 0.034 | 8.065 ± 0.044 |
1.083 ± 0.017 | 3.223 ± 0.023 |
Most of the basic statistics you can see at this page can be downloaded from this CSV file
See this proteome in:

Proteome-pI is available under Creative Commons Attribution-NoDerivs license, for more details see here
| Reference: Kozlowski LP. Proteome-pI 2.0: Proteome Isoelectric Point Database Update. Nucleic Acids Res. 2021, doi: 10.1093/nar/gkab944 | Contact: Lukasz P. Kozlowski |