Candidatus Nitrospira nitrosa
Taxonomy: cellular organisms; Bacteria; Nitrospirae; Nitrospira; Nitrospirales; Nitrospiraceae; Nitrospira
Average proteome isoelectric point is 6.82
Get precalculated fractions of proteins
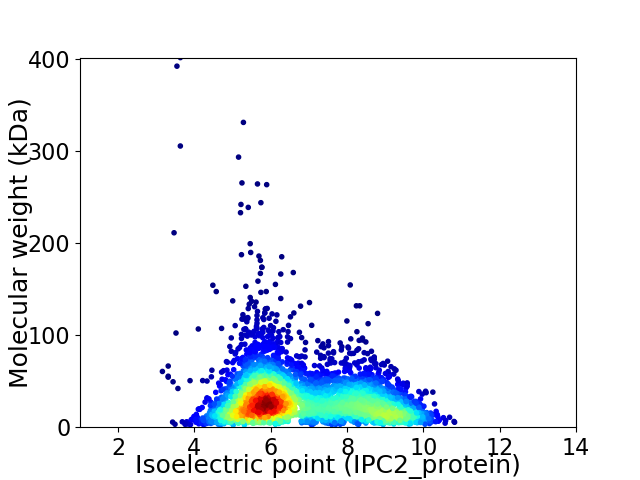
Virtual 2D-PAGE plot for 4245 proteins (isoelectric point calculated using IPC2_protein)
Get csv file with sequences according to given criteria:
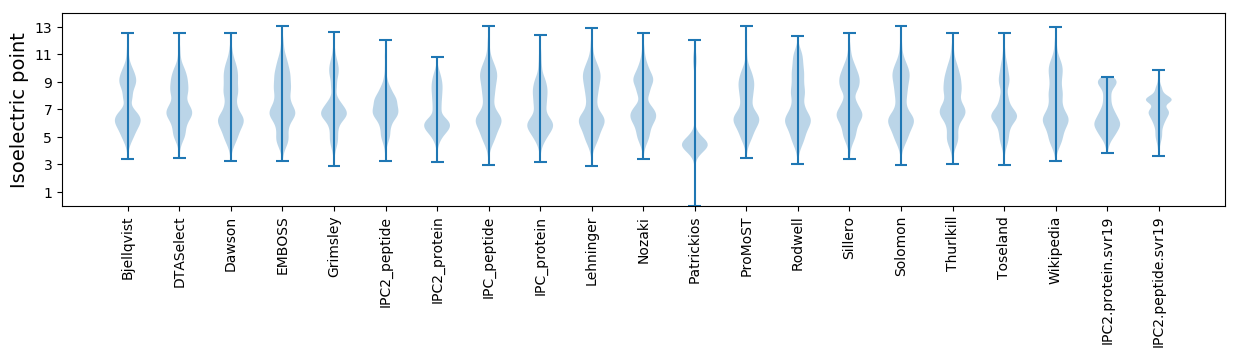
* You can choose from 21 different methods for calculating isoelectric point
Summary statistics related to proteome-wise predictions
Protein with the lowest isoelectric point:
>tr|A0A0S4LLI8|A0A0S4LLI8_9BACT Lipoprotein-releasing system transmembrane protein LolC OS=Candidatus Nitrospira nitrosa OX=1742972 GN=lolC PE=4 SV=1
MM1 pKa = 7.06YY2 pKa = 8.14PARR5 pKa = 11.84SVSLLAFHH13 pKa = 6.92VNVADD18 pKa = 4.19EE19 pKa = 4.6LDD21 pKa = 3.88GALSVSVIVTVLMMLPLATVIVAWFSPCVAFEE53 pKa = 4.1VSTLAVMVPLADD65 pKa = 3.81PEE67 pKa = 4.37VV68 pKa = 3.35
MM1 pKa = 7.06YY2 pKa = 8.14PARR5 pKa = 11.84SVSLLAFHH13 pKa = 6.92VNVADD18 pKa = 4.19EE19 pKa = 4.6LDD21 pKa = 3.88GALSVSVIVTVLMMLPLATVIVAWFSPCVAFEE53 pKa = 4.1VSTLAVMVPLADD65 pKa = 3.81PEE67 pKa = 4.37VV68 pKa = 3.35
Molecular weight: 7.22 kDa
Isoelectric point according different methods:
Protein with the highest isoelectric point:
>tr|A0A0S4L6Q0|A0A0S4L6Q0_9BACT Prepilin leader peptidase/N-methyltransferase OS=Candidatus Nitrospira nitrosa OX=1742972 GN=pilD PE=3 SV=1
MM1 pKa = 7.61SFTFQQPSNLKK12 pKa = 9.85KK13 pKa = 10.33KK14 pKa = 9.99RR15 pKa = 11.84EE16 pKa = 3.76HH17 pKa = 6.33GFRR20 pKa = 11.84KK21 pKa = 10.0RR22 pKa = 11.84MSTKK26 pKa = 10.18NGRR29 pKa = 11.84KK30 pKa = 8.58VLARR34 pKa = 11.84RR35 pKa = 11.84RR36 pKa = 11.84AKK38 pKa = 10.22GRR40 pKa = 11.84ARR42 pKa = 11.84LTVV45 pKa = 3.04
MM1 pKa = 7.61SFTFQQPSNLKK12 pKa = 9.85KK13 pKa = 10.33KK14 pKa = 9.99RR15 pKa = 11.84EE16 pKa = 3.76HH17 pKa = 6.33GFRR20 pKa = 11.84KK21 pKa = 10.0RR22 pKa = 11.84MSTKK26 pKa = 10.18NGRR29 pKa = 11.84KK30 pKa = 8.58VLARR34 pKa = 11.84RR35 pKa = 11.84RR36 pKa = 11.84AKK38 pKa = 10.22GRR40 pKa = 11.84ARR42 pKa = 11.84LTVV45 pKa = 3.04
Molecular weight: 5.36 kDa
Isoelectric point according different methods:
Peptides (in silico digests for buttom-up proteomics)
Below you can find in silico digests of the whole proteome with Trypsin, Chymotrypsin, Trypsin+LysC, LysN, ArgC proteases suitable for different mass spec machines.| Try ESI |
 |
|---|
| ChTry ESI |
|
|---|
| ArgC ESI |
|
|---|
| LysN ESI |
|
|---|
| TryLysC ESI |
|
|---|
| Try MALDI |
|
|---|
| ChTry MALDI |
|
|---|
| ArgC MALDI |
|
|---|
| LysN MALDI |
|
|---|
| TryLysC MALDI |
|
|---|
| Try LTQ |
|
|---|
| ChTry LTQ |
|
|---|
| ArgC LTQ |
|
|---|
| LysN LTQ |
|
|---|
| TryLysC LTQ |
|
|---|
| Try MSlow |
|
|---|
| ChTry MSlow |
|
|---|
| ArgC MSlow |
|
|---|
| LysN MSlow |
|
|---|
| TryLysC MSlow |
|
|---|
| Try MShigh |
|
|---|
| ChTry MShigh |
|
|---|
| ArgC MShigh |
|
|---|
| LysN MShigh |
|
|---|
| TryLysC MShigh |
|
|---|
General Statistics
Number of major isoforms |
Number of additional isoforms |
Number of all proteins |
Number of amino acids |
Min. Seq. Length |
Max. Seq. Length |
Avg. Seq. Length |
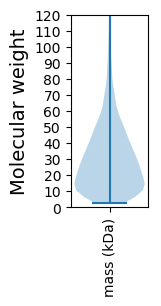
Avg. Mol. Weight |
|---|---|---|---|---|---|---|---|
0 |
1268829 |
21 |
3949 |
298.9 |
32.99 |
Amino acid frequency
Ala |
Cys |
Asp |
Glu |
Phe |
Gly |
His |
Ile |
Lys |
Leu |
|---|---|---|---|---|---|---|---|---|---|
9.201 ± 0.038 | 1.04 ± 0.015 |
5.172 ± 0.037 | 5.943 ± 0.037 |
3.616 ± 0.022 | 7.833 ± 0.046 |
2.436 ± 0.022 | 5.349 ± 0.026 |
4.077 ± 0.037 | 10.521 ± 0.046 |
Met |
Asn |
Gln |
Pro |
Arg |
Ser |
Thr |
Val |
Trp |
Tyr |
|---|---|---|---|---|---|---|---|---|---|
2.398 ± 0.019 | 2.828 ± 0.029 |
4.972 ± 0.025 | 4.187 ± 0.027 |
6.653 ± 0.037 | 6.121 ± 0.031 |
5.99 ± 0.041 | 7.688 ± 0.035 |
1.379 ± 0.019 | 2.596 ± 0.022 |
Most of the basic statistics you can see at this page can be downloaded from this CSV file
See this proteome in:

Proteome-pI is available under Creative Commons Attribution-NoDerivs license, for more details see here
| Reference: Kozlowski LP. Proteome-pI 2.0: Proteome Isoelectric Point Database Update. Nucleic Acids Res. 2021, doi: 10.1093/nar/gkab944 | Contact: Lukasz P. Kozlowski |