Lysinibacillus composti
Taxonomy: cellular organisms; Bacteria; Terrabacteria group; Firmicutes; Bacilli; Bacillales; Bacillaceae; Lysinibacillus
Average proteome isoelectric point is 6.13
Get precalculated fractions of proteins
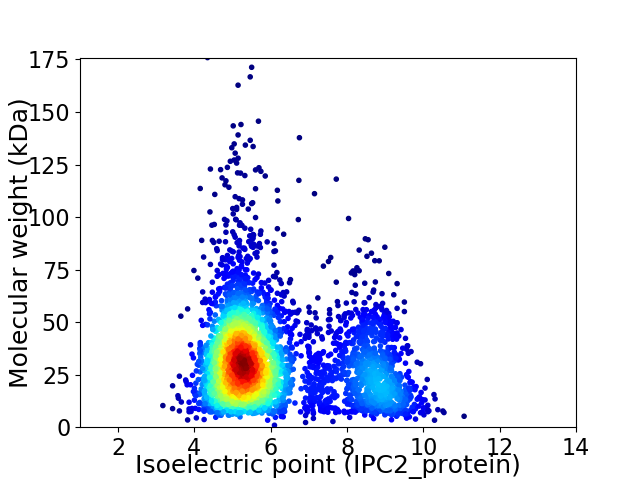
Virtual 2D-PAGE plot for 3831 proteins (isoelectric point calculated using IPC2_protein)
Get csv file with sequences according to given criteria:
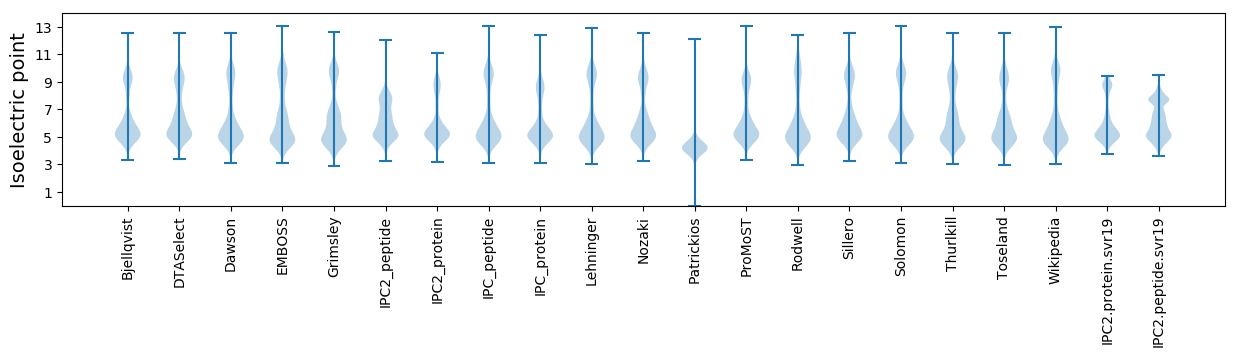
* You can choose from 21 different methods for calculating isoelectric point
Summary statistics related to proteome-wise predictions
Protein with the lowest isoelectric point:
>tr|A0A3N9UI56|A0A3N9UI56_9BACI Ferritin-like domain-containing protein OS=Lysinibacillus composti OX=720633 GN=EBB45_03745 PE=4 SV=1
MM1 pKa = 7.45NDD3 pKa = 2.88KK4 pKa = 9.74TFLLNMYY11 pKa = 11.12AMLNQMQSQLNQCKK25 pKa = 10.24SYY27 pKa = 11.35LEE29 pKa = 4.34NEE31 pKa = 4.19LDD33 pKa = 3.75EE34 pKa = 5.31KK35 pKa = 11.25GYY37 pKa = 10.85DD38 pKa = 3.62YY39 pKa = 11.21STMLEE44 pKa = 4.46DD45 pKa = 3.58YY46 pKa = 10.54DD47 pKa = 4.71VAGFDD52 pKa = 3.29QDD54 pKa = 3.7EE55 pKa = 4.69VFNEE59 pKa = 4.33RR60 pKa = 11.84PSS62 pKa = 3.19
MM1 pKa = 7.45NDD3 pKa = 2.88KK4 pKa = 9.74TFLLNMYY11 pKa = 11.12AMLNQMQSQLNQCKK25 pKa = 10.24SYY27 pKa = 11.35LEE29 pKa = 4.34NEE31 pKa = 4.19LDD33 pKa = 3.75EE34 pKa = 5.31KK35 pKa = 11.25GYY37 pKa = 10.85DD38 pKa = 3.62YY39 pKa = 11.21STMLEE44 pKa = 4.46DD45 pKa = 3.58YY46 pKa = 10.54DD47 pKa = 4.71VAGFDD52 pKa = 3.29QDD54 pKa = 3.7EE55 pKa = 4.69VFNEE59 pKa = 4.33RR60 pKa = 11.84PSS62 pKa = 3.19
Molecular weight: 7.38 kDa
Isoelectric point according different methods:
Protein with the highest isoelectric point:
>tr|A0A3N9UCE0|A0A3N9UCE0_9BACI Histidine kinase OS=Lysinibacillus composti OX=720633 GN=walK PE=4 SV=1
MM1 pKa = 7.36KK2 pKa = 9.43RR3 pKa = 11.84TYY5 pKa = 9.54QPKK8 pKa = 9.44KK9 pKa = 7.96RR10 pKa = 11.84KK11 pKa = 8.69HH12 pKa = 5.94SKK14 pKa = 8.54VHH16 pKa = 5.68GFRR19 pKa = 11.84ARR21 pKa = 11.84MSTKK25 pKa = 10.19NGRR28 pKa = 11.84KK29 pKa = 8.91VLAARR34 pKa = 11.84RR35 pKa = 11.84RR36 pKa = 11.84KK37 pKa = 8.81GRR39 pKa = 11.84KK40 pKa = 8.75VLSAA44 pKa = 4.05
MM1 pKa = 7.36KK2 pKa = 9.43RR3 pKa = 11.84TYY5 pKa = 9.54QPKK8 pKa = 9.44KK9 pKa = 7.96RR10 pKa = 11.84KK11 pKa = 8.69HH12 pKa = 5.94SKK14 pKa = 8.54VHH16 pKa = 5.68GFRR19 pKa = 11.84ARR21 pKa = 11.84MSTKK25 pKa = 10.19NGRR28 pKa = 11.84KK29 pKa = 8.91VLAARR34 pKa = 11.84RR35 pKa = 11.84RR36 pKa = 11.84KK37 pKa = 8.81GRR39 pKa = 11.84KK40 pKa = 8.75VLSAA44 pKa = 4.05
Molecular weight: 5.21 kDa
Isoelectric point according different methods:
Peptides (in silico digests for buttom-up proteomics)
Below you can find in silico digests of the whole proteome with Trypsin, Chymotrypsin, Trypsin+LysC, LysN, ArgC proteases suitable for different mass spec machines.| Try ESI |
 |
|---|
| ChTry ESI |
|
|---|
| ArgC ESI |
|
|---|
| LysN ESI |
|
|---|
| TryLysC ESI |
|
|---|
| Try MALDI |
|
|---|
| ChTry MALDI |
|
|---|
| ArgC MALDI |
|
|---|
| LysN MALDI |
|
|---|
| TryLysC MALDI |
|
|---|
| Try LTQ |
|
|---|
| ChTry LTQ |
|
|---|
| ArgC LTQ |
|
|---|
| LysN LTQ |
|
|---|
| TryLysC LTQ |
|
|---|
| Try MSlow |
|
|---|
| ChTry MSlow |
|
|---|
| ArgC MSlow |
|
|---|
| LysN MSlow |
|
|---|
| TryLysC MSlow |
|
|---|
| Try MShigh |
|
|---|
| ChTry MShigh |
|
|---|
| ArgC MShigh |
|
|---|
| LysN MShigh |
|
|---|
| TryLysC MShigh |
|
|---|
General Statistics
Number of major isoforms |
Number of additional isoforms |
Number of all proteins |
Number of amino acids |
Min. Seq. Length |
Max. Seq. Length |
Avg. Seq. Length |
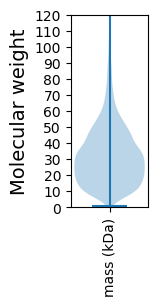
Avg. Mol. Weight |
|---|---|---|---|---|---|---|---|
0 |
1145423 |
8 |
1654 |
299.0 |
33.54 |
Amino acid frequency
Ala |
Cys |
Asp |
Glu |
Phe |
Gly |
His |
Ile |
Lys |
Leu |
|---|---|---|---|---|---|---|---|---|---|
6.913 ± 0.042 | 0.69 ± 0.012 |
4.95 ± 0.031 | 7.65 ± 0.047 |
4.622 ± 0.037 | 6.72 ± 0.045 |
1.969 ± 0.018 | 8.31 ± 0.039 |
6.731 ± 0.036 | 9.723 ± 0.046 |
Met |
Asn |
Gln |
Pro |
Arg |
Ser |
Thr |
Val |
Trp |
Tyr |
|---|---|---|---|---|---|---|---|---|---|
2.637 ± 0.016 | 4.746 ± 0.032 |
3.527 ± 0.021 | 3.741 ± 0.027 |
3.791 ± 0.028 | 6.054 ± 0.028 |
5.586 ± 0.03 | 7.188 ± 0.03 |
0.934 ± 0.014 | 3.518 ± 0.022 |
Most of the basic statistics you can see at this page can be downloaded from this CSV file
See this proteome in:

Proteome-pI is available under Creative Commons Attribution-NoDerivs license, for more details see here
| Reference: Kozlowski LP. Proteome-pI 2.0: Proteome Isoelectric Point Database Update. Nucleic Acids Res. 2021, doi: 10.1093/nar/gkab944 | Contact: Lukasz P. Kozlowski |