Oecophyllibacter saccharovorans
Taxonomy: cellular organisms; Bacteria; Proteobacteria; Alphaproteobacteria; Rhodospirillales;
Average proteome isoelectric point is 6.85
Get precalculated fractions of proteins
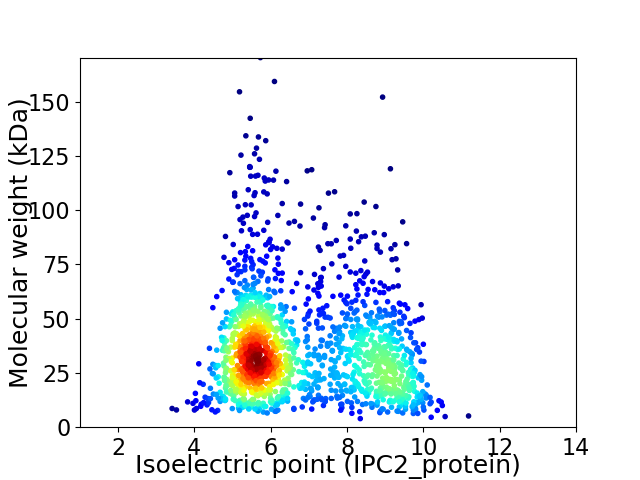
Virtual 2D-PAGE plot for 1612 proteins (isoelectric point calculated using IPC2_protein)
Get csv file with sequences according to given criteria:
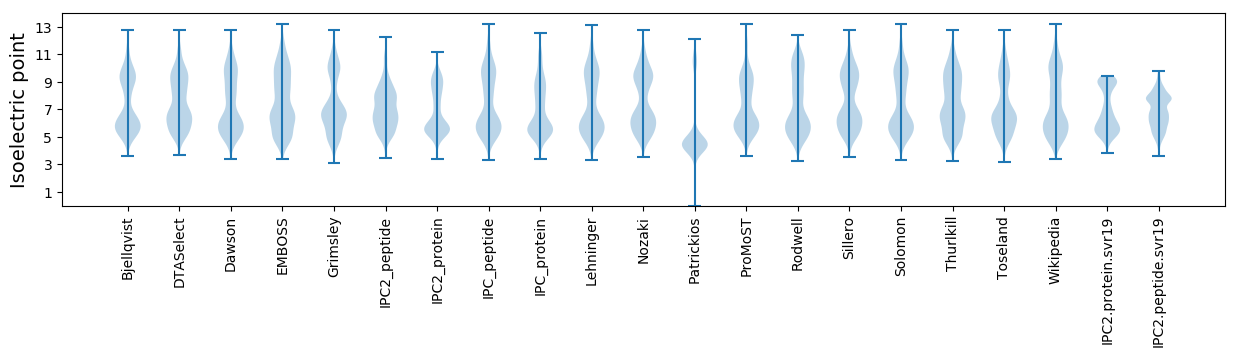
* You can choose from 21 different methods for calculating isoelectric point
Summary statistics related to proteome-wise predictions
Protein with the lowest isoelectric point:
>tr|A0A506UR95|A0A506UR95_9PROT TlyA family RNA methyltransferase OS=Oecophyllibacter saccharovorans OX=2558360 GN=E3202_02760 PE=4 SV=1
MM1 pKa = 7.22QEE3 pKa = 3.96LNIFEE8 pKa = 4.28VEE10 pKa = 4.21EE11 pKa = 4.14VSGGFSLGFVDD22 pKa = 5.92SVAGAINMAADD33 pKa = 4.02CGEE36 pKa = 4.19AGAIIGGRR44 pKa = 11.84FGGSNGGLVGLGPVGNLVGVIYY66 pKa = 10.2GAAYY70 pKa = 9.58GAIGGAILGAVDD82 pKa = 4.39GNSGTASVQKK92 pKa = 10.6QIMQGITSGTISPANAGAGGGSSLSS117 pKa = 3.56
MM1 pKa = 7.22QEE3 pKa = 3.96LNIFEE8 pKa = 4.28VEE10 pKa = 4.21EE11 pKa = 4.14VSGGFSLGFVDD22 pKa = 5.92SVAGAINMAADD33 pKa = 4.02CGEE36 pKa = 4.19AGAIIGGRR44 pKa = 11.84FGGSNGGLVGLGPVGNLVGVIYY66 pKa = 10.2GAAYY70 pKa = 9.58GAIGGAILGAVDD82 pKa = 4.39GNSGTASVQKK92 pKa = 10.6QIMQGITSGTISPANAGAGGGSSLSS117 pKa = 3.56
Molecular weight: 10.99 kDa
Isoelectric point according different methods:
Protein with the highest isoelectric point:
>tr|A0A506UQ66|A0A506UQ66_9PROT Peptide deformylase OS=Oecophyllibacter saccharovorans OX=2558360 GN=def PE=3 SV=1
MM1 pKa = 7.35KK2 pKa = 9.4RR3 pKa = 11.84TYY5 pKa = 10.2QPSRR9 pKa = 11.84LVRR12 pKa = 11.84KK13 pKa = 8.99RR14 pKa = 11.84RR15 pKa = 11.84HH16 pKa = 4.7GFRR19 pKa = 11.84SRR21 pKa = 11.84SATVGGRR28 pKa = 11.84RR29 pKa = 11.84VLANRR34 pKa = 11.84RR35 pKa = 11.84AKK37 pKa = 9.85GRR39 pKa = 11.84KK40 pKa = 8.87RR41 pKa = 11.84LSAA44 pKa = 3.96
MM1 pKa = 7.35KK2 pKa = 9.4RR3 pKa = 11.84TYY5 pKa = 10.2QPSRR9 pKa = 11.84LVRR12 pKa = 11.84KK13 pKa = 8.99RR14 pKa = 11.84RR15 pKa = 11.84HH16 pKa = 4.7GFRR19 pKa = 11.84SRR21 pKa = 11.84SATVGGRR28 pKa = 11.84RR29 pKa = 11.84VLANRR34 pKa = 11.84RR35 pKa = 11.84AKK37 pKa = 9.85GRR39 pKa = 11.84KK40 pKa = 8.87RR41 pKa = 11.84LSAA44 pKa = 3.96
Molecular weight: 5.18 kDa
Isoelectric point according different methods:
Peptides (in silico digests for buttom-up proteomics)
Below you can find in silico digests of the whole proteome with Trypsin, Chymotrypsin, Trypsin+LysC, LysN, ArgC proteases suitable for different mass spec machines.| Try ESI |
 |
|---|
| ChTry ESI |
|
|---|
| ArgC ESI |
|
|---|
| LysN ESI |
|
|---|
| TryLysC ESI |
|
|---|
| Try MALDI |
|
|---|
| ChTry MALDI |
|
|---|
| ArgC MALDI |
|
|---|
| LysN MALDI |
|
|---|
| TryLysC MALDI |
|
|---|
| Try LTQ |
|
|---|
| ChTry LTQ |
|
|---|
| ArgC LTQ |
|
|---|
| LysN LTQ |
|
|---|
| TryLysC LTQ |
|
|---|
| Try MSlow |
|
|---|
| ChTry MSlow |
|
|---|
| ArgC MSlow |
|
|---|
| LysN MSlow |
|
|---|
| TryLysC MSlow |
|
|---|
| Try MShigh |
|
|---|
| ChTry MShigh |
|
|---|
| ArgC MShigh |
|
|---|
| LysN MShigh |
|
|---|
| TryLysC MShigh |
|
|---|
General Statistics
Number of major isoforms |
Number of additional isoforms |
Number of all proteins |
Number of amino acids |
Min. Seq. Length |
Max. Seq. Length |
Avg. Seq. Length |
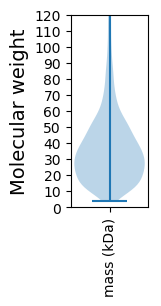
Avg. Mol. Weight |
|---|---|---|---|---|---|---|---|
0 |
560048 |
37 |
1519 |
347.4 |
37.79 |
Amino acid frequency
Ala |
Cys |
Asp |
Glu |
Phe |
Gly |
His |
Ile |
Lys |
Leu |
|---|---|---|---|---|---|---|---|---|---|
11.687 ± 0.068 | 1.038 ± 0.018 |
4.787 ± 0.038 | 5.826 ± 0.071 |
3.402 ± 0.039 | 8.585 ± 0.066 |
2.412 ± 0.027 | 4.144 ± 0.048 |
3.067 ± 0.046 | 11.327 ± 0.088 |
Met |
Asn |
Gln |
Pro |
Arg |
Ser |
Thr |
Val |
Trp |
Tyr |
|---|---|---|---|---|---|---|---|---|---|
2.334 ± 0.027 | 2.561 ± 0.035 |
6.309 ± 0.049 | 4.189 ± 0.052 |
7.237 ± 0.059 | 5.524 ± 0.041 |
5.396 ± 0.042 | 6.712 ± 0.056 |
1.392 ± 0.024 | 2.071 ± 0.028 |
Most of the basic statistics you can see at this page can be downloaded from this CSV file
See this proteome in:

Proteome-pI is available under Creative Commons Attribution-NoDerivs license, for more details see here
| Reference: Kozlowski LP. Proteome-pI 2.0: Proteome Isoelectric Point Database Update. Nucleic Acids Res. 2021, doi: 10.1093/nar/gkab944 | Contact: Lukasz P. Kozlowski |