Stx2-converting phage 1717
Taxonomy: Viruses; Duplodnaviria; Heunggongvirae; Uroviricota; Caudoviricetes; Caudovirales; Siphoviridae; Pankowvirus; Escherichia virus 1717
Average proteome isoelectric point is 7.14
Get precalculated fractions of proteins
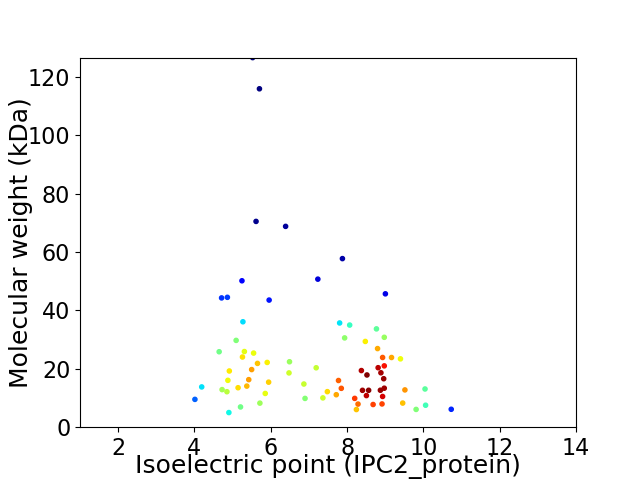
Virtual 2D-PAGE plot for 77 proteins (isoelectric point calculated using IPC2_protein)
Get csv file with sequences according to given criteria:
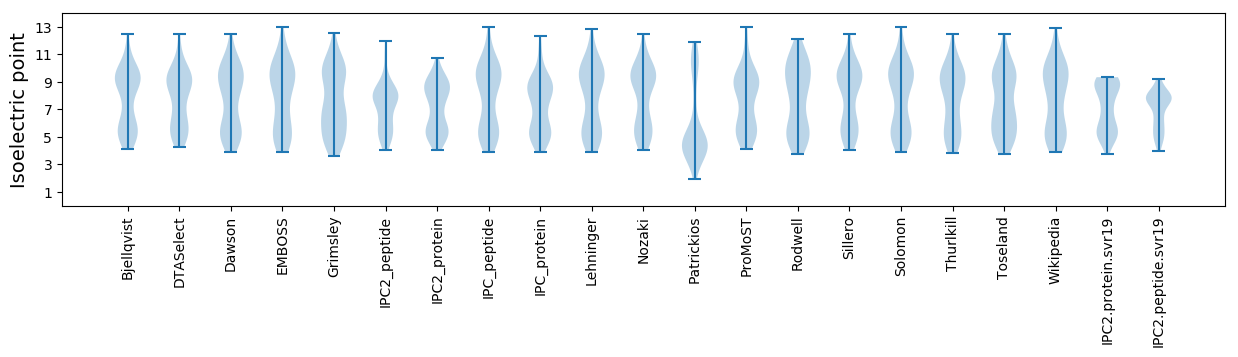
* You can choose from 21 different methods for calculating isoelectric point
Summary statistics related to proteome-wise predictions
Protein with the lowest isoelectric point:
>tr|B6DZT7|B6DZT7_9CAUD N protein OS=Stx2-converting phage 1717 OX=563769 PE=4 SV=1
MM1 pKa = 7.62EE2 pKa = 4.36FHH4 pKa = 7.21EE5 pKa = 5.34SAICDD10 pKa = 3.52FRR12 pKa = 11.84ANANSVKK19 pKa = 9.25PQPIAVLFKK28 pKa = 10.94TMGAWAVLCFAADD41 pKa = 3.76DD42 pKa = 4.28TDD44 pKa = 3.9DD45 pKa = 3.38TDD47 pKa = 3.53ARR49 pKa = 11.84MAIGQEE55 pKa = 4.02MEE57 pKa = 3.99MDD59 pKa = 3.55PTNDD63 pKa = 2.86EE64 pKa = 4.58FIIYY68 pKa = 7.71GAPSNYY74 pKa = 10.43LLDD77 pKa = 3.47TCNIYY82 pKa = 10.99NKK84 pKa = 10.37AAA86 pKa = 3.64
MM1 pKa = 7.62EE2 pKa = 4.36FHH4 pKa = 7.21EE5 pKa = 5.34SAICDD10 pKa = 3.52FRR12 pKa = 11.84ANANSVKK19 pKa = 9.25PQPIAVLFKK28 pKa = 10.94TMGAWAVLCFAADD41 pKa = 3.76DD42 pKa = 4.28TDD44 pKa = 3.9DD45 pKa = 3.38TDD47 pKa = 3.53ARR49 pKa = 11.84MAIGQEE55 pKa = 4.02MEE57 pKa = 3.99MDD59 pKa = 3.55PTNDD63 pKa = 2.86EE64 pKa = 4.58FIIYY68 pKa = 7.71GAPSNYY74 pKa = 10.43LLDD77 pKa = 3.47TCNIYY82 pKa = 10.99NKK84 pKa = 10.37AAA86 pKa = 3.64
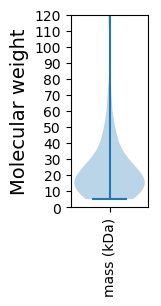
Molecular weight: 9.53 kDa
Isoelectric point according different methods:
Protein with the highest isoelectric point:
>tr|B6DZX1|B6DZX1_9CAUD Restriction endonuclease OS=Stx2-converting phage 1717 OX=563769 PE=4 SV=1
MM1 pKa = 7.33SSKK4 pKa = 10.49NRR6 pKa = 11.84TRR8 pKa = 11.84RR9 pKa = 11.84TTTRR13 pKa = 11.84NIRR16 pKa = 11.84FRR18 pKa = 11.84NQMIEE23 pKa = 4.08QINIALTRR31 pKa = 11.84KK32 pKa = 6.96VQKK35 pKa = 10.34IFLRR39 pKa = 11.84GSLNLAAGSWQQTT52 pKa = 3.39
MM1 pKa = 7.33SSKK4 pKa = 10.49NRR6 pKa = 11.84TRR8 pKa = 11.84RR9 pKa = 11.84TTTRR13 pKa = 11.84NIRR16 pKa = 11.84FRR18 pKa = 11.84NQMIEE23 pKa = 4.08QINIALTRR31 pKa = 11.84KK32 pKa = 6.96VQKK35 pKa = 10.34IFLRR39 pKa = 11.84GSLNLAAGSWQQTT52 pKa = 3.39
Molecular weight: 6.14 kDa
Isoelectric point according different methods:
Peptides (in silico digests for buttom-up proteomics)
Below you can find in silico digests of the whole proteome with Trypsin, Chymotrypsin, Trypsin+LysC, LysN, ArgC proteases suitable for different mass spec machines.| Try ESI |
 |
|---|
| ChTry ESI |
|
|---|
| ArgC ESI |
|
|---|
| LysN ESI |
|
|---|
| TryLysC ESI |
|
|---|
| Try MALDI |
|
|---|
| ChTry MALDI |
|
|---|
| ArgC MALDI |
|
|---|
| LysN MALDI |
|
|---|
| TryLysC MALDI |
|
|---|
| Try LTQ |
|
|---|
| ChTry LTQ |
|
|---|
| ArgC LTQ |
|
|---|
| LysN LTQ |
|
|---|
| TryLysC LTQ |
|
|---|
| Try MSlow |
|
|---|
| ChTry MSlow |
|
|---|
| ArgC MSlow |
|
|---|
| LysN MSlow |
|
|---|
| TryLysC MSlow |
|
|---|
| Try MShigh |
|
|---|
| ChTry MShigh |
|
|---|
| ArgC MShigh |
|
|---|
| LysN MShigh |
|
|---|
| TryLysC MShigh |
|
|---|
General Statistics
Number of major isoforms |
Number of additional isoforms |
Number of all proteins |
Number of amino acids |
Min. Seq. Length |
Max. Seq. Length |
Avg. Seq. Length |
Avg. Mol. Weight |
|---|---|---|---|---|---|---|---|
0 |
16574 |
44 |
1159 |
215.2 |
23.97 |
Amino acid frequency
Ala |
Cys |
Asp |
Glu |
Phe |
Gly |
His |
Ile |
Lys |
Leu |
|---|---|---|---|---|---|---|---|---|---|
9.382 ± 0.55 | 1.448 ± 0.164 |
5.484 ± 0.22 | 6.492 ± 0.275 |
3.228 ± 0.159 | 7.204 ± 0.35 |
2.027 ± 0.161 | 5.316 ± 0.269 |
5.43 ± 0.287 | 8.218 ± 0.271 |
Met |
Asn |
Gln |
Pro |
Arg |
Ser |
Thr |
Val |
Trp |
Tyr |
|---|---|---|---|---|---|---|---|---|---|
2.709 ± 0.188 | 4.32 ± 0.213 |
4.133 ± 0.283 | 4.32 ± 0.26 |
6.908 ± 0.319 | 6.836 ± 0.212 |
5.708 ± 0.349 | 6.42 ± 0.26 |
1.695 ± 0.121 | 2.721 ± 0.148 |
Most of the basic statistics you can see at this page can be downloaded from this CSV file
See this proteome in:

Proteome-pI is available under Creative Commons Attribution-NoDerivs license, for more details see here
| Reference: Kozlowski LP. Proteome-pI 2.0: Proteome Isoelectric Point Database Update. Nucleic Acids Res. 2021, doi: 10.1093/nar/gkab944 | Contact: Lukasz P. Kozlowski |