Agrobacterium phage Atu_ph02
Taxonomy: Viruses; Duplodnaviria; Heunggongvirae; Uroviricota; Caudoviricetes; Caudovirales; Autographiviridae; Atuphduovirus; Agrobacterium virus Atuph02
Average proteome isoelectric point is 6.71
Get precalculated fractions of proteins
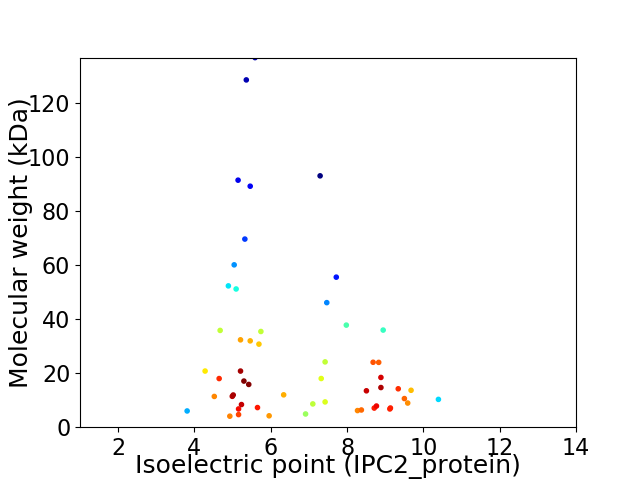
Virtual 2D-PAGE plot for 55 proteins (isoelectric point calculated using IPC2_protein)
Get csv file with sequences according to given criteria:
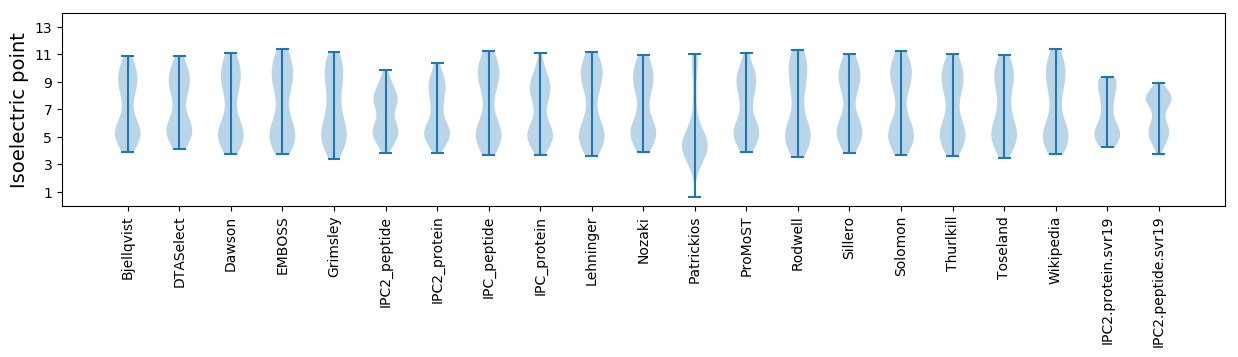
* You can choose from 21 different methods for calculating isoelectric point
Summary statistics related to proteome-wise predictions
Protein with the lowest isoelectric point:
>tr|A0A2L0UYY1|A0A2L0UYY1_9CAUD Uncharacterized protein OS=Agrobacterium phage Atu_ph02 OX=2024261 PE=4 SV=1
MM1 pKa = 8.43DD2 pKa = 3.88YY3 pKa = 11.01TDD5 pKa = 5.58LSDD8 pKa = 3.42EE9 pKa = 4.59SKK11 pKa = 10.65ISLAIEE17 pKa = 4.29FVAIGQPLPDD27 pKa = 4.85VLASWLKK34 pKa = 11.31DD35 pKa = 3.05NGLYY39 pKa = 10.69DD40 pKa = 6.28LITKK44 pKa = 9.96PGFNAGLPDD53 pKa = 3.83GNAA56 pKa = 3.36
MM1 pKa = 8.43DD2 pKa = 3.88YY3 pKa = 11.01TDD5 pKa = 5.58LSDD8 pKa = 3.42EE9 pKa = 4.59SKK11 pKa = 10.65ISLAIEE17 pKa = 4.29FVAIGQPLPDD27 pKa = 4.85VLASWLKK34 pKa = 11.31DD35 pKa = 3.05NGLYY39 pKa = 10.69DD40 pKa = 6.28LITKK44 pKa = 9.96PGFNAGLPDD53 pKa = 3.83GNAA56 pKa = 3.36
Molecular weight: 6.01 kDa
Isoelectric point according different methods:
Protein with the highest isoelectric point:
>tr|A0A2L0UYY2|A0A2L0UYY2_9CAUD Uncharacterized protein OS=Agrobacterium phage Atu_ph02 OX=2024261 PE=4 SV=1
MM1 pKa = 7.59EE2 pKa = 5.46LLIFILIALMTVIGLLIMMARR23 pKa = 11.84LHH25 pKa = 6.61LKK27 pKa = 10.43RR28 pKa = 11.84FLGYY32 pKa = 9.85PNAVDD37 pKa = 3.35IGATIVFTMLFHH49 pKa = 6.13GTFAGMVVVGFASLMLSLSLWALRR73 pKa = 11.84SSIGCEE79 pKa = 3.45RR80 pKa = 11.84LAVRR84 pKa = 11.84YY85 pKa = 10.02GRR87 pKa = 11.84MGRR90 pKa = 11.84PIVYY94 pKa = 8.98WKK96 pKa = 8.85TIPASEE102 pKa = 4.75CAPHH106 pKa = 5.76WLARR110 pKa = 11.84IFSINNPLKK119 pKa = 10.46GAHH122 pKa = 5.99AA123 pKa = 4.65
MM1 pKa = 7.59EE2 pKa = 5.46LLIFILIALMTVIGLLIMMARR23 pKa = 11.84LHH25 pKa = 6.61LKK27 pKa = 10.43RR28 pKa = 11.84FLGYY32 pKa = 9.85PNAVDD37 pKa = 3.35IGATIVFTMLFHH49 pKa = 6.13GTFAGMVVVGFASLMLSLSLWALRR73 pKa = 11.84SSIGCEE79 pKa = 3.45RR80 pKa = 11.84LAVRR84 pKa = 11.84YY85 pKa = 10.02GRR87 pKa = 11.84MGRR90 pKa = 11.84PIVYY94 pKa = 8.98WKK96 pKa = 8.85TIPASEE102 pKa = 4.75CAPHH106 pKa = 5.76WLARR110 pKa = 11.84IFSINNPLKK119 pKa = 10.46GAHH122 pKa = 5.99AA123 pKa = 4.65
Molecular weight: 13.66 kDa
Isoelectric point according different methods:
Peptides (in silico digests for buttom-up proteomics)
Below you can find in silico digests of the whole proteome with Trypsin, Chymotrypsin, Trypsin+LysC, LysN, ArgC proteases suitable for different mass spec machines.| Try ESI |
 |
|---|
| ChTry ESI |
|
|---|
| ArgC ESI |
|
|---|
| LysN ESI |
|
|---|
| TryLysC ESI |
|
|---|
| Try MALDI |
|
|---|
| ChTry MALDI |
|
|---|
| ArgC MALDI |
|
|---|
| LysN MALDI |
|
|---|
| TryLysC MALDI |
|
|---|
| Try LTQ |
|
|---|
| ChTry LTQ |
|
|---|
| ArgC LTQ |
|
|---|
| LysN LTQ |
|
|---|
| TryLysC LTQ |
|
|---|
| Try MSlow |
|
|---|
| ChTry MSlow |
|
|---|
| ArgC MSlow |
|
|---|
| LysN MSlow |
|
|---|
| TryLysC MSlow |
|
|---|
| Try MShigh |
|
|---|
| ChTry MShigh |
|
|---|
| ArgC MShigh |
|
|---|
| LysN MShigh |
|
|---|
| TryLysC MShigh |
|
|---|
General Statistics
Number of major isoforms |
Number of additional isoforms |
Number of all proteins |
Number of amino acids |
Min. Seq. Length |
Max. Seq. Length |
Avg. Seq. Length |
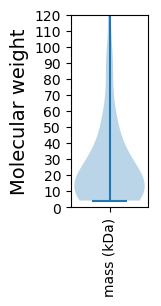
Avg. Mol. Weight |
|---|---|---|---|---|---|---|---|
0 |
14004 |
37 |
1254 |
254.6 |
28.24 |
Amino acid frequency
Ala |
Cys |
Asp |
Glu |
Phe |
Gly |
His |
Ile |
Lys |
Leu |
|---|---|---|---|---|---|---|---|---|---|
10.454 ± 0.644 | 0.621 ± 0.129 |
6.605 ± 0.234 | 5.827 ± 0.282 |
3.37 ± 0.21 | 7.705 ± 0.295 |
1.949 ± 0.193 | 5.063 ± 0.19 |
5.62 ± 0.375 | 7.741 ± 0.278 |
Met |
Asn |
Gln |
Pro |
Arg |
Ser |
Thr |
Val |
Trp |
Tyr |
|---|---|---|---|---|---|---|---|---|---|
2.771 ± 0.183 | 4.156 ± 0.23 |
4.427 ± 0.187 | 4.484 ± 0.252 |
6.07 ± 0.218 | 5.298 ± 0.259 |
5.905 ± 0.243 | 6.941 ± 0.291 |
1.75 ± 0.127 | 3.242 ± 0.17 |
Most of the basic statistics you can see at this page can be downloaded from this CSV file
See this proteome in:

Proteome-pI is available under Creative Commons Attribution-NoDerivs license, for more details see here
| Reference: Kozlowski LP. Proteome-pI 2.0: Proteome Isoelectric Point Database Update. Nucleic Acids Res. 2021, doi: 10.1093/nar/gkab944 | Contact: Lukasz P. Kozlowski |