Prevotella sp. CAG:386
Taxonomy: cellular organisms; Bacteria; FCB group; Bacteroidetes/Chlorobi group; Bacteroidetes; Bacteroidia; Bacteroidales; Prevotellaceae; Prevotella; environmental samples
Average proteome isoelectric point is 6.55
Get precalculated fractions of proteins
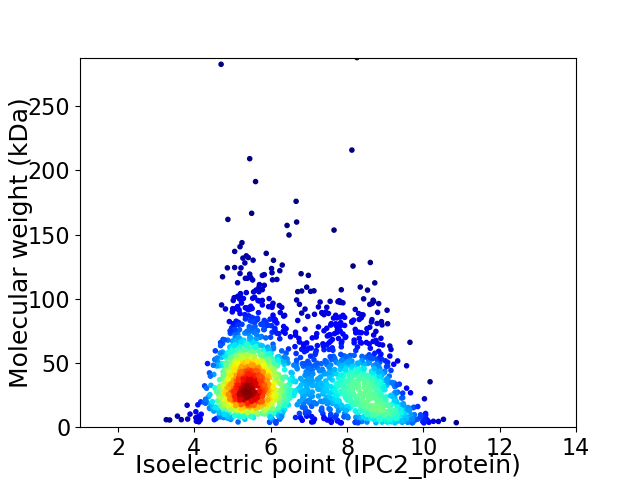
Virtual 2D-PAGE plot for 2132 proteins (isoelectric point calculated using IPC2_protein)
Get csv file with sequences according to given criteria:
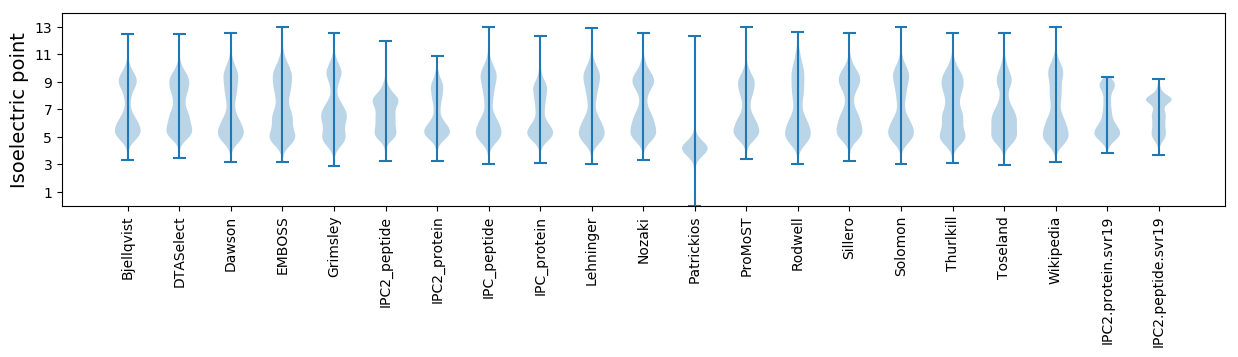
* You can choose from 21 different methods for calculating isoelectric point
Summary statistics related to proteome-wise predictions
Protein with the lowest isoelectric point:
>tr|R6QYQ7|R6QYQ7_9BACT Transcriptional regulator AraC family OS=Prevotella sp. CAG:386 OX=1262925 GN=BN637_00306 PE=4 SV=1
MM1 pKa = 6.69MKK3 pKa = 10.19KK4 pKa = 9.85YY5 pKa = 10.89VCDD8 pKa = 3.47VCGWVYY14 pKa = 10.9DD15 pKa = 4.13PEE17 pKa = 5.19VGDD20 pKa = 4.11PEE22 pKa = 5.4GGIAPGTAFEE32 pKa = 5.97DD33 pKa = 4.28IPDD36 pKa = 3.74DD37 pKa = 4.06WVCPLCGVGKK47 pKa = 10.39DD48 pKa = 3.73EE49 pKa = 5.35FSPMDD54 pKa = 3.34
MM1 pKa = 6.69MKK3 pKa = 10.19KK4 pKa = 9.85YY5 pKa = 10.89VCDD8 pKa = 3.47VCGWVYY14 pKa = 10.9DD15 pKa = 4.13PEE17 pKa = 5.19VGDD20 pKa = 4.11PEE22 pKa = 5.4GGIAPGTAFEE32 pKa = 5.97DD33 pKa = 4.28IPDD36 pKa = 3.74DD37 pKa = 4.06WVCPLCGVGKK47 pKa = 10.39DD48 pKa = 3.73EE49 pKa = 5.35FSPMDD54 pKa = 3.34
Molecular weight: 5.89 kDa
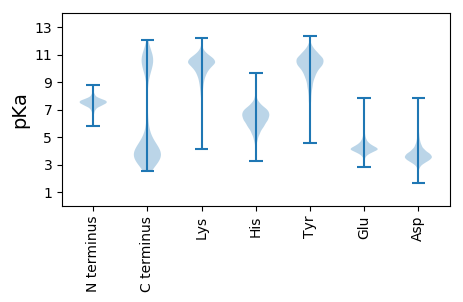
Isoelectric point according different methods:
Protein with the highest isoelectric point:
>tr|R6Q579|R6Q579_9BACT KHG/KDPG family aldolase/carbohydrate kinase PfkB family OS=Prevotella sp. CAG:386 OX=1262925 GN=BN637_01792 PE=4 SV=1
MM1 pKa = 7.85PNGKK5 pKa = 9.19KK6 pKa = 10.25KK7 pKa = 10.12KK8 pKa = 7.0GHH10 pKa = 6.14KK11 pKa = 9.06MATHH15 pKa = 6.13KK16 pKa = 10.39RR17 pKa = 11.84KK18 pKa = 9.84KK19 pKa = 9.28RR20 pKa = 11.84LRR22 pKa = 11.84KK23 pKa = 9.25NRR25 pKa = 11.84HH26 pKa = 4.69KK27 pKa = 11.1SKK29 pKa = 11.1
MM1 pKa = 7.85PNGKK5 pKa = 9.19KK6 pKa = 10.25KK7 pKa = 10.12KK8 pKa = 7.0GHH10 pKa = 6.14KK11 pKa = 9.06MATHH15 pKa = 6.13KK16 pKa = 10.39RR17 pKa = 11.84KK18 pKa = 9.84KK19 pKa = 9.28RR20 pKa = 11.84LRR22 pKa = 11.84KK23 pKa = 9.25NRR25 pKa = 11.84HH26 pKa = 4.69KK27 pKa = 11.1SKK29 pKa = 11.1
Molecular weight: 3.54 kDa
Isoelectric point according different methods:
Peptides (in silico digests for buttom-up proteomics)
Below you can find in silico digests of the whole proteome with Trypsin, Chymotrypsin, Trypsin+LysC, LysN, ArgC proteases suitable for different mass spec machines.| Try ESI |
 |
|---|
| ChTry ESI |
|
|---|
| ArgC ESI |
|
|---|
| LysN ESI |
|
|---|
| TryLysC ESI |
|
|---|
| Try MALDI |
|
|---|
| ChTry MALDI |
|
|---|
| ArgC MALDI |
|
|---|
| LysN MALDI |
|
|---|
| TryLysC MALDI |
|
|---|
| Try LTQ |
|
|---|
| ChTry LTQ |
|
|---|
| ArgC LTQ |
|
|---|
| LysN LTQ |
|
|---|
| TryLysC LTQ |
|
|---|
| Try MSlow |
|
|---|
| ChTry MSlow |
|
|---|
| ArgC MSlow |
|
|---|
| LysN MSlow |
|
|---|
| TryLysC MSlow |
|
|---|
| Try MShigh |
|
|---|
| ChTry MShigh |
|
|---|
| ArgC MShigh |
|
|---|
| LysN MShigh |
|
|---|
| TryLysC MShigh |
|
|---|
General Statistics
Number of major isoforms |
Number of additional isoforms |
Number of all proteins |
Number of amino acids |
Min. Seq. Length |
Max. Seq. Length |
Avg. Seq. Length |
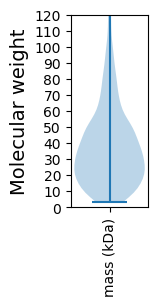
Avg. Mol. Weight |
|---|---|---|---|---|---|---|---|
0 |
747993 |
29 |
2619 |
350.8 |
39.48 |
Amino acid frequency
Ala |
Cys |
Asp |
Glu |
Phe |
Gly |
His |
Ile |
Lys |
Leu |
|---|---|---|---|---|---|---|---|---|---|
7.52 ± 0.045 | 1.335 ± 0.02 |
5.804 ± 0.032 | 6.18 ± 0.056 |
4.401 ± 0.037 | 6.975 ± 0.059 |
2.099 ± 0.023 | 6.587 ± 0.041 |
6.892 ± 0.049 | 8.718 ± 0.057 |
Met |
Asn |
Gln |
Pro |
Arg |
Ser |
Thr |
Val |
Trp |
Tyr |
|---|---|---|---|---|---|---|---|---|---|
3.028 ± 0.027 | 5.072 ± 0.048 |
3.506 ± 0.025 | 3.691 ± 0.029 |
4.435 ± 0.039 | 5.991 ± 0.04 |
5.539 ± 0.043 | 6.664 ± 0.044 |
1.235 ± 0.022 | 4.327 ± 0.044 |
Most of the basic statistics you can see at this page can be downloaded from this CSV file
See this proteome in:

Proteome-pI is available under Creative Commons Attribution-NoDerivs license, for more details see here
| Reference: Kozlowski LP. Proteome-pI 2.0: Proteome Isoelectric Point Database Update. Nucleic Acids Res. 2021, doi: 10.1093/nar/gkab944 | Contact: Lukasz P. Kozlowski |