Mycobacterium phage Florinda
Taxonomy: Viruses; Duplodnaviria; Heunggongvirae; Uroviricota; Caudoviricetes; Caudovirales; Siphoviridae; Cheoctovirus; unclassified Cheoctovirus
Average proteome isoelectric point is 6.18
Get precalculated fractions of proteins
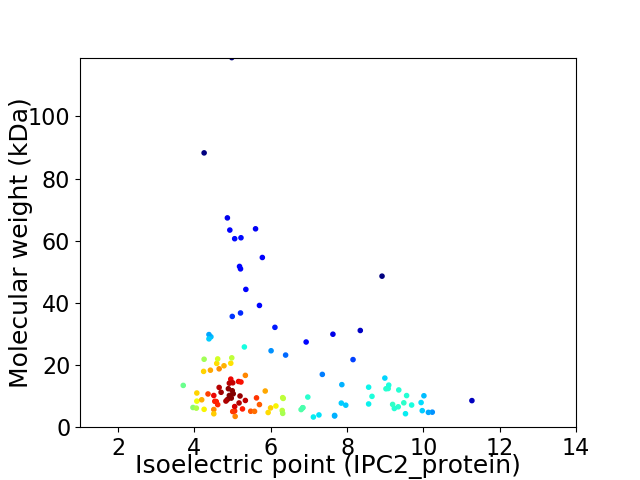
Virtual 2D-PAGE plot for 117 proteins (isoelectric point calculated using IPC2_protein)
Get csv file with sequences according to given criteria:
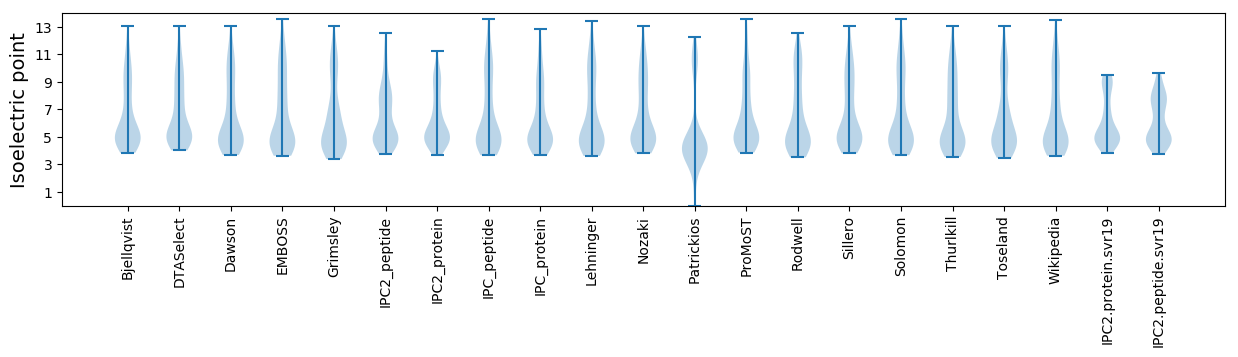
* You can choose from 21 different methods for calculating isoelectric point
Summary statistics related to proteome-wise predictions
Protein with the lowest isoelectric point:
>tr|A0A0K1LR35|A0A0K1LR35_9CAUD Minor tail protein OS=Mycobacterium phage Florinda OX=1675549 GN=FLORINDA_17 PE=4 SV=1
MM1 pKa = 7.4AQTIHH6 pKa = 6.12VLPVNDD12 pKa = 5.17LIEE15 pKa = 6.26HH16 pKa = 6.88EE17 pKa = 5.15DD18 pKa = 4.37DD19 pKa = 5.63SDD21 pKa = 3.8EE22 pKa = 4.68CPCGPDD28 pKa = 3.17IEE30 pKa = 4.88PVFDD34 pKa = 5.14ADD36 pKa = 4.79GACGWVITHH45 pKa = 6.86HH46 pKa = 6.49SLDD49 pKa = 3.22GRR51 pKa = 11.84EE52 pKa = 3.86RR53 pKa = 11.84FEE55 pKa = 3.97
MM1 pKa = 7.4AQTIHH6 pKa = 6.12VLPVNDD12 pKa = 5.17LIEE15 pKa = 6.26HH16 pKa = 6.88EE17 pKa = 5.15DD18 pKa = 4.37DD19 pKa = 5.63SDD21 pKa = 3.8EE22 pKa = 4.68CPCGPDD28 pKa = 3.17IEE30 pKa = 4.88PVFDD34 pKa = 5.14ADD36 pKa = 4.79GACGWVITHH45 pKa = 6.86HH46 pKa = 6.49SLDD49 pKa = 3.22GRR51 pKa = 11.84EE52 pKa = 3.86RR53 pKa = 11.84FEE55 pKa = 3.97
Molecular weight: 6.13 kDa
Isoelectric point according different methods:
Protein with the highest isoelectric point:
>tr|A0A0K1LRG7|A0A0K1LRG7_9CAUD Uncharacterized protein OS=Mycobacterium phage Florinda OX=1675549 GN=FLORINDA_64 PE=4 SV=1
MM1 pKa = 7.46ARR3 pKa = 11.84LGRR6 pKa = 11.84AWLGAAWRR14 pKa = 11.84GRR16 pKa = 11.84AWQARR21 pKa = 11.84LGMAWLGMARR31 pKa = 11.84PGSAWQAWQGTARR44 pKa = 11.84RR45 pKa = 11.84GAAGRR50 pKa = 11.84GTAWQARR57 pKa = 11.84QGLARR62 pKa = 11.84RR63 pKa = 11.84GMAGMAGLGWATSQTQGG80 pKa = 3.41
MM1 pKa = 7.46ARR3 pKa = 11.84LGRR6 pKa = 11.84AWLGAAWRR14 pKa = 11.84GRR16 pKa = 11.84AWQARR21 pKa = 11.84LGMAWLGMARR31 pKa = 11.84PGSAWQAWQGTARR44 pKa = 11.84RR45 pKa = 11.84GAAGRR50 pKa = 11.84GTAWQARR57 pKa = 11.84QGLARR62 pKa = 11.84RR63 pKa = 11.84GMAGMAGLGWATSQTQGG80 pKa = 3.41
Molecular weight: 8.55 kDa
Isoelectric point according different methods:
Peptides (in silico digests for buttom-up proteomics)
Below you can find in silico digests of the whole proteome with Trypsin, Chymotrypsin, Trypsin+LysC, LysN, ArgC proteases suitable for different mass spec machines.| Try ESI |
 |
|---|
| ChTry ESI |
|
|---|
| ArgC ESI |
|
|---|
| LysN ESI |
|
|---|
| TryLysC ESI |
|
|---|
| Try MALDI |
|
|---|
| ChTry MALDI |
|
|---|
| ArgC MALDI |
|
|---|
| LysN MALDI |
|
|---|
| TryLysC MALDI |
|
|---|
| Try LTQ |
|
|---|
| ChTry LTQ |
|
|---|
| ArgC LTQ |
|
|---|
| LysN LTQ |
|
|---|
| TryLysC LTQ |
|
|---|
| Try MSlow |
|
|---|
| ChTry MSlow |
|
|---|
| ArgC MSlow |
|
|---|
| LysN MSlow |
|
|---|
| TryLysC MSlow |
|
|---|
| Try MShigh |
|
|---|
| ChTry MShigh |
|
|---|
| ArgC MShigh |
|
|---|
| LysN MShigh |
|
|---|
| TryLysC MShigh |
|
|---|
General Statistics
Number of major isoforms |
Number of additional isoforms |
Number of all proteins |
Number of amino acids |
Min. Seq. Length |
Max. Seq. Length |
Avg. Seq. Length |
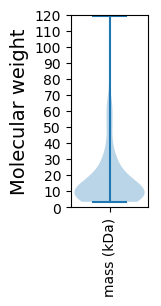
Avg. Mol. Weight |
|---|---|---|---|---|---|---|---|
0 |
19064 |
28 |
1174 |
162.9 |
17.81 |
Amino acid frequency
Ala |
Cys |
Asp |
Glu |
Phe |
Gly |
His |
Ile |
Lys |
Leu |
|---|---|---|---|---|---|---|---|---|---|
10.622 ± 0.424 | 1.269 ± 0.166 |
6.803 ± 0.215 | 5.775 ± 0.281 |
2.89 ± 0.182 | 9.096 ± 0.553 |
2.198 ± 0.191 | 4.265 ± 0.165 |
3.326 ± 0.206 | 7.181 ± 0.207 |
Met |
Asn |
Gln |
Pro |
Arg |
Ser |
Thr |
Val |
Trp |
Tyr |
|---|---|---|---|---|---|---|---|---|---|
2.334 ± 0.134 | 3.399 ± 0.154 |
6.053 ± 0.18 | 3.446 ± 0.166 |
6.961 ± 0.412 | 5.781 ± 0.285 |
6.646 ± 0.242 | 7.118 ± 0.269 |
2.366 ± 0.155 | 2.471 ± 0.154 |
Most of the basic statistics you can see at this page can be downloaded from this CSV file
See this proteome in:

Proteome-pI is available under Creative Commons Attribution-NoDerivs license, for more details see here
| Reference: Kozlowski LP. Proteome-pI 2.0: Proteome Isoelectric Point Database Update. Nucleic Acids Res. 2021, doi: 10.1093/nar/gkab944 | Contact: Lukasz P. Kozlowski |