Salmonella virus Chi
Taxonomy: Viruses; Duplodnaviria; Heunggongvirae; Uroviricota; Caudoviricetes; Caudovirales; Siphoviridae; Chivirus
Average proteome isoelectric point is 6.28
Get precalculated fractions of proteins
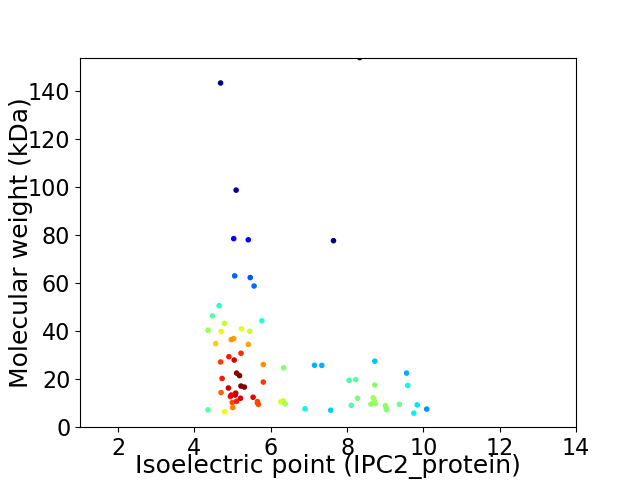
Virtual 2D-PAGE plot for 75 proteins (isoelectric point calculated using IPC2_protein)
Get csv file with sequences according to given criteria:
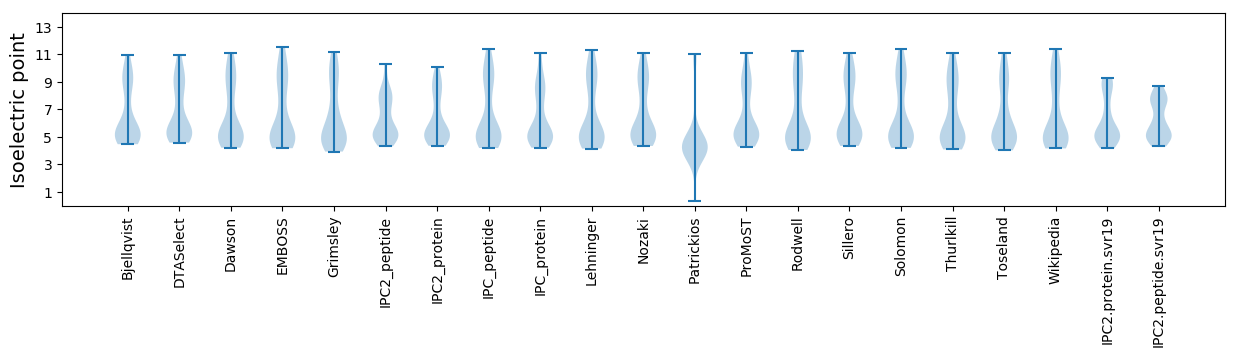
* You can choose from 21 different methods for calculating isoelectric point
Summary statistics related to proteome-wise predictions
Protein with the lowest isoelectric point:
>tr|M9NTK4|M9NTK4_9CAUD Transcriptional regulator OS=Salmonella virus Chi OX=1541887 GN=3 PE=4 SV=1
MM1 pKa = 7.41AGLWFFVVTICGAVGADD18 pKa = 4.09NMAADD23 pKa = 3.87CHH25 pKa = 7.17DD26 pKa = 3.9YY27 pKa = 11.38VIDD30 pKa = 4.68AGISYY35 pKa = 10.14DD36 pKa = 3.5DD37 pKa = 4.35CRR39 pKa = 11.84ASVAAYY45 pKa = 8.11PGRR48 pKa = 11.84IGLYY52 pKa = 8.41SARR55 pKa = 11.84CDD57 pKa = 2.91RR58 pKa = 11.84GEE60 pKa = 3.96VVEE63 pKa = 4.71GGNHH67 pKa = 4.72EE68 pKa = 4.2
MM1 pKa = 7.41AGLWFFVVTICGAVGADD18 pKa = 4.09NMAADD23 pKa = 3.87CHH25 pKa = 7.17DD26 pKa = 3.9YY27 pKa = 11.38VIDD30 pKa = 4.68AGISYY35 pKa = 10.14DD36 pKa = 3.5DD37 pKa = 4.35CRR39 pKa = 11.84ASVAAYY45 pKa = 8.11PGRR48 pKa = 11.84IGLYY52 pKa = 8.41SARR55 pKa = 11.84CDD57 pKa = 2.91RR58 pKa = 11.84GEE60 pKa = 3.96VVEE63 pKa = 4.71GGNHH67 pKa = 4.72EE68 pKa = 4.2
Molecular weight: 7.2 kDa
Isoelectric point according different methods:
Protein with the highest isoelectric point:
>tr|M9NTJ9|M9NTJ9_9CAUD Uncharacterized protein OS=Salmonella virus Chi OX=1541887 GN=68 PE=4 SV=1
MM1 pKa = 7.33RR2 pKa = 11.84QSACFAPVGVGFSYY16 pKa = 10.6RR17 pKa = 11.84IQKK20 pKa = 9.01FKK22 pKa = 10.61AWRR25 pKa = 11.84RR26 pKa = 11.84VPFGGGDD33 pKa = 3.32GAADD37 pKa = 3.68VGRR40 pKa = 11.84GGAMRR45 pKa = 11.84PGVAIGGALMCGG57 pKa = 3.52
MM1 pKa = 7.33RR2 pKa = 11.84QSACFAPVGVGFSYY16 pKa = 10.6RR17 pKa = 11.84IQKK20 pKa = 9.01FKK22 pKa = 10.61AWRR25 pKa = 11.84RR26 pKa = 11.84VPFGGGDD33 pKa = 3.32GAADD37 pKa = 3.68VGRR40 pKa = 11.84GGAMRR45 pKa = 11.84PGVAIGGALMCGG57 pKa = 3.52
Molecular weight: 5.85 kDa
Isoelectric point according different methods:
Peptides (in silico digests for buttom-up proteomics)
Below you can find in silico digests of the whole proteome with Trypsin, Chymotrypsin, Trypsin+LysC, LysN, ArgC proteases suitable for different mass spec machines.| Try ESI |
 |
|---|
| ChTry ESI |
|
|---|
| ArgC ESI |
|
|---|
| LysN ESI |
|
|---|
| TryLysC ESI |
|
|---|
| Try MALDI |
|
|---|
| ChTry MALDI |
|
|---|
| ArgC MALDI |
|
|---|
| LysN MALDI |
|
|---|
| TryLysC MALDI |
|
|---|
| Try LTQ |
|
|---|
| ChTry LTQ |
|
|---|
| ArgC LTQ |
|
|---|
| LysN LTQ |
|
|---|
| TryLysC LTQ |
|
|---|
| Try MSlow |
|
|---|
| ChTry MSlow |
|
|---|
| ArgC MSlow |
|
|---|
| LysN MSlow |
|
|---|
| TryLysC MSlow |
|
|---|
| Try MShigh |
|
|---|
| ChTry MShigh |
|
|---|
| ArgC MShigh |
|
|---|
| LysN MShigh |
|
|---|
| TryLysC MShigh |
|
|---|
General Statistics
Number of major isoforms |
Number of additional isoforms |
Number of all proteins |
Number of amino acids |
Min. Seq. Length |
Max. Seq. Length |
Avg. Seq. Length |
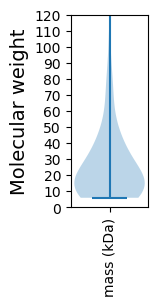
Avg. Mol. Weight |
|---|---|---|---|---|---|---|---|
0 |
18962 |
57 |
1431 |
252.8 |
28.11 |
Amino acid frequency
Ala |
Cys |
Asp |
Glu |
Phe |
Gly |
His |
Ile |
Lys |
Leu |
|---|---|---|---|---|---|---|---|---|---|
9.883 ± 0.542 | 0.928 ± 0.114 |
6.692 ± 0.26 | 6.16 ± 0.298 |
3.507 ± 0.154 | 7.241 ± 0.295 |
1.709 ± 0.167 | 5.474 ± 0.144 |
5.179 ± 0.287 | 7.315 ± 0.275 |
Met |
Asn |
Gln |
Pro |
Arg |
Ser |
Thr |
Val |
Trp |
Tyr |
|---|---|---|---|---|---|---|---|---|---|
3.064 ± 0.106 | 4.224 ± 0.222 |
4.704 ± 0.422 | 3.855 ± 0.386 |
5.949 ± 0.229 | 5.437 ± 0.207 |
6.328 ± 0.289 | 7.151 ± 0.281 |
1.735 ± 0.143 | 3.465 ± 0.19 |
Most of the basic statistics you can see at this page can be downloaded from this CSV file
See this proteome in:

Proteome-pI is available under Creative Commons Attribution-NoDerivs license, for more details see here
| Reference: Kozlowski LP. Proteome-pI 2.0: Proteome Isoelectric Point Database Update. Nucleic Acids Res. 2021, doi: 10.1093/nar/gkab944 | Contact: Lukasz P. Kozlowski |