Acidaminococcus sp. CAG:917
Taxonomy: cellular organisms; Bacteria; Terrabacteria group; Firmicutes; Negativicutes; Acidaminococcales; Acidaminococcaceae; Acidaminococcus; environmental samples
Average proteome isoelectric point is 6.35
Get precalculated fractions of proteins
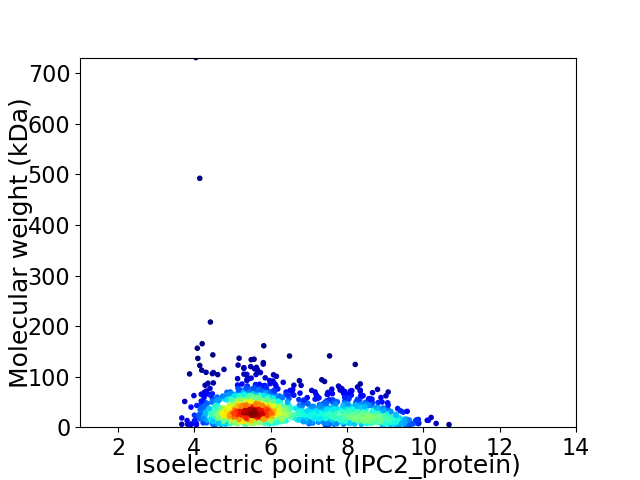
Virtual 2D-PAGE plot for 1276 proteins (isoelectric point calculated using IPC2_protein)
Get csv file with sequences according to given criteria:
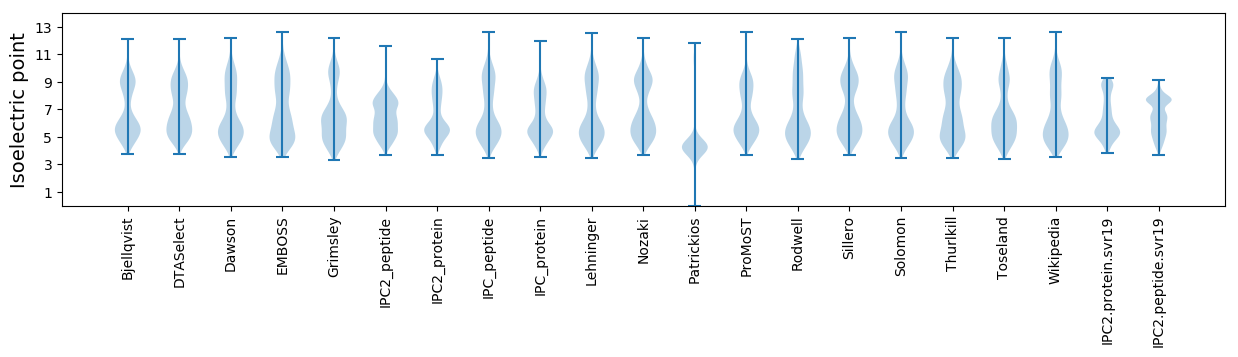
* You can choose from 21 different methods for calculating isoelectric point
Summary statistics related to proteome-wise predictions
Protein with the lowest isoelectric point:
>tr|R7K8C2|R7K8C2_9FIRM Uncharacterized protein OS=Acidaminococcus sp. CAG:917 OX=1262688 GN=BN810_00857 PE=4 SV=1
MM1 pKa = 7.54TNNNDD6 pKa = 3.43DD7 pKa = 3.61EE8 pKa = 5.56KK9 pKa = 11.05EE10 pKa = 4.13FKK12 pKa = 10.42EE13 pKa = 4.31LSLKK17 pKa = 10.29EE18 pKa = 4.06KK19 pKa = 10.51QNLVALVASSDD30 pKa = 3.15ADD32 pKa = 3.51YY33 pKa = 11.33DD34 pKa = 4.03KK35 pKa = 11.34KK36 pKa = 11.31LEE38 pKa = 4.31AYY40 pKa = 9.9AYY42 pKa = 9.49LCEE45 pKa = 4.37NGEE48 pKa = 4.26EE49 pKa = 4.43VVDD52 pKa = 5.5DD53 pKa = 4.4MIKK56 pKa = 10.68AQLTADD62 pKa = 3.93EE63 pKa = 5.16EE64 pKa = 4.64SGQMLVEE71 pKa = 3.91ILANYY76 pKa = 9.51KK77 pKa = 9.8GRR79 pKa = 11.84KK80 pKa = 9.45DD81 pKa = 3.21IFLLLVSYY89 pKa = 8.09FYY91 pKa = 10.72RR92 pKa = 11.84GEE94 pKa = 4.08DD95 pKa = 3.14VALFARR101 pKa = 11.84LLGSYY106 pKa = 10.25GDD108 pKa = 3.87EE109 pKa = 3.94AAIDD113 pKa = 3.68ILKK116 pKa = 10.73SFAKK120 pKa = 10.29QFEE123 pKa = 4.45DD124 pKa = 3.28EE125 pKa = 4.28LNYY128 pKa = 11.02NEE130 pKa = 4.96FMEE133 pKa = 4.25IRR135 pKa = 11.84NAVEE139 pKa = 3.67EE140 pKa = 4.3LGGDD144 pKa = 3.61FDD146 pKa = 6.91LNTDD150 pKa = 4.47FSNDD154 pKa = 2.68PFYY157 pKa = 11.02RR158 pKa = 11.84YY159 pKa = 10.16LKK161 pKa = 10.2GLDD164 pKa = 3.5MSDD167 pKa = 3.77LPEE170 pKa = 5.98DD171 pKa = 4.07EE172 pKa = 6.42SDD174 pKa = 4.21DD175 pKa = 4.24CDD177 pKa = 5.7CEE179 pKa = 4.37EE180 pKa = 5.42CDD182 pKa = 5.21GNCEE186 pKa = 5.04DD187 pKa = 6.03DD188 pKa = 4.45CDD190 pKa = 5.02CDD192 pKa = 3.71GHH194 pKa = 7.31DD195 pKa = 4.2GHH197 pKa = 7.69CHH199 pKa = 7.06DD200 pKa = 5.34EE201 pKa = 4.04NCGCHH206 pKa = 4.75GHH208 pKa = 6.64KK209 pKa = 10.32KK210 pKa = 10.13
MM1 pKa = 7.54TNNNDD6 pKa = 3.43DD7 pKa = 3.61EE8 pKa = 5.56KK9 pKa = 11.05EE10 pKa = 4.13FKK12 pKa = 10.42EE13 pKa = 4.31LSLKK17 pKa = 10.29EE18 pKa = 4.06KK19 pKa = 10.51QNLVALVASSDD30 pKa = 3.15ADD32 pKa = 3.51YY33 pKa = 11.33DD34 pKa = 4.03KK35 pKa = 11.34KK36 pKa = 11.31LEE38 pKa = 4.31AYY40 pKa = 9.9AYY42 pKa = 9.49LCEE45 pKa = 4.37NGEE48 pKa = 4.26EE49 pKa = 4.43VVDD52 pKa = 5.5DD53 pKa = 4.4MIKK56 pKa = 10.68AQLTADD62 pKa = 3.93EE63 pKa = 5.16EE64 pKa = 4.64SGQMLVEE71 pKa = 3.91ILANYY76 pKa = 9.51KK77 pKa = 9.8GRR79 pKa = 11.84KK80 pKa = 9.45DD81 pKa = 3.21IFLLLVSYY89 pKa = 8.09FYY91 pKa = 10.72RR92 pKa = 11.84GEE94 pKa = 4.08DD95 pKa = 3.14VALFARR101 pKa = 11.84LLGSYY106 pKa = 10.25GDD108 pKa = 3.87EE109 pKa = 3.94AAIDD113 pKa = 3.68ILKK116 pKa = 10.73SFAKK120 pKa = 10.29QFEE123 pKa = 4.45DD124 pKa = 3.28EE125 pKa = 4.28LNYY128 pKa = 11.02NEE130 pKa = 4.96FMEE133 pKa = 4.25IRR135 pKa = 11.84NAVEE139 pKa = 3.67EE140 pKa = 4.3LGGDD144 pKa = 3.61FDD146 pKa = 6.91LNTDD150 pKa = 4.47FSNDD154 pKa = 2.68PFYY157 pKa = 11.02RR158 pKa = 11.84YY159 pKa = 10.16LKK161 pKa = 10.2GLDD164 pKa = 3.5MSDD167 pKa = 3.77LPEE170 pKa = 5.98DD171 pKa = 4.07EE172 pKa = 6.42SDD174 pKa = 4.21DD175 pKa = 4.24CDD177 pKa = 5.7CEE179 pKa = 4.37EE180 pKa = 5.42CDD182 pKa = 5.21GNCEE186 pKa = 5.04DD187 pKa = 6.03DD188 pKa = 4.45CDD190 pKa = 5.02CDD192 pKa = 3.71GHH194 pKa = 7.31DD195 pKa = 4.2GHH197 pKa = 7.69CHH199 pKa = 7.06DD200 pKa = 5.34EE201 pKa = 4.04NCGCHH206 pKa = 4.75GHH208 pKa = 6.64KK209 pKa = 10.32KK210 pKa = 10.13
Molecular weight: 23.87 kDa
Isoelectric point according different methods:
Protein with the highest isoelectric point:
>tr|R7K9M1|R7K9M1_9FIRM Uncharacterized protein OS=Acidaminococcus sp. CAG:917 OX=1262688 GN=BN810_00041 PE=4 SV=1
MM1 pKa = 7.52GKK3 pKa = 9.83GAKK6 pKa = 9.09KK7 pKa = 10.41DD8 pKa = 3.6YY9 pKa = 10.36FGLGRR14 pKa = 11.84IVSIILAIIPVTAWLLGAITRR35 pKa = 11.84IMDD38 pKa = 3.94GGLGIVFGIIRR49 pKa = 11.84LIGGGFILWIIDD61 pKa = 4.77LILMIVRR68 pKa = 11.84GSILRR73 pKa = 11.84IAA75 pKa = 4.19
MM1 pKa = 7.52GKK3 pKa = 9.83GAKK6 pKa = 9.09KK7 pKa = 10.41DD8 pKa = 3.6YY9 pKa = 10.36FGLGRR14 pKa = 11.84IVSIILAIIPVTAWLLGAITRR35 pKa = 11.84IMDD38 pKa = 3.94GGLGIVFGIIRR49 pKa = 11.84LIGGGFILWIIDD61 pKa = 4.77LILMIVRR68 pKa = 11.84GSILRR73 pKa = 11.84IAA75 pKa = 4.19
Molecular weight: 8.03 kDa
Isoelectric point according different methods:
Peptides (in silico digests for buttom-up proteomics)
Below you can find in silico digests of the whole proteome with Trypsin, Chymotrypsin, Trypsin+LysC, LysN, ArgC proteases suitable for different mass spec machines.| Try ESI |
 |
|---|
| ChTry ESI |
|
|---|
| ArgC ESI |
|
|---|
| LysN ESI |
|
|---|
| TryLysC ESI |
|
|---|
| Try MALDI |
|
|---|
| ChTry MALDI |
|
|---|
| ArgC MALDI |
|
|---|
| LysN MALDI |
|
|---|
| TryLysC MALDI |
|
|---|
| Try LTQ |
|
|---|
| ChTry LTQ |
|
|---|
| ArgC LTQ |
|
|---|
| LysN LTQ |
|
|---|
| TryLysC LTQ |
|
|---|
| Try MSlow |
|
|---|
| ChTry MSlow |
|
|---|
| ArgC MSlow |
|
|---|
| LysN MSlow |
|
|---|
| TryLysC MSlow |
|
|---|
| Try MShigh |
|
|---|
| ChTry MShigh |
|
|---|
| ArgC MShigh |
|
|---|
| LysN MShigh |
|
|---|
| TryLysC MShigh |
|
|---|
General Statistics
Number of major isoforms |
Number of additional isoforms |
Number of all proteins |
Number of amino acids |
Min. Seq. Length |
Max. Seq. Length |
Avg. Seq. Length |
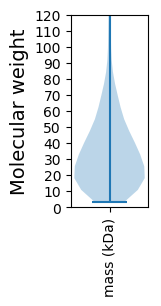
Avg. Mol. Weight |
|---|---|---|---|---|---|---|---|
0 |
414890 |
30 |
6614 |
325.1 |
36.23 |
Amino acid frequency
Ala |
Cys |
Asp |
Glu |
Phe |
Gly |
His |
Ile |
Lys |
Leu |
|---|---|---|---|---|---|---|---|---|---|
7.504 ± 0.07 | 1.557 ± 0.039 |
6.116 ± 0.059 | 6.96 ± 0.068 |
4.683 ± 0.045 | 6.864 ± 0.06 |
1.285 ± 0.03 | 7.408 ± 0.053 |
8.415 ± 0.107 | 8.819 ± 0.071 |
Met |
Asn |
Gln |
Pro |
Arg |
Ser |
Thr |
Val |
Trp |
Tyr |
|---|---|---|---|---|---|---|---|---|---|
2.446 ± 0.037 | 4.724 ± 0.062 |
3.082 ± 0.039 | 2.439 ± 0.03 |
3.557 ± 0.061 | 6.606 ± 0.069 |
5.439 ± 0.089 | 7.368 ± 0.054 |
0.627 ± 0.021 | 4.09 ± 0.079 |
Most of the basic statistics you can see at this page can be downloaded from this CSV file
See this proteome in:

Proteome-pI is available under Creative Commons Attribution-NoDerivs license, for more details see here
| Reference: Kozlowski LP. Proteome-pI 2.0: Proteome Isoelectric Point Database Update. Nucleic Acids Res. 2021, doi: 10.1093/nar/gkab944 | Contact: Lukasz P. Kozlowski |