Lysobacter psychrotolerans
Taxonomy: cellular organisms; Bacteria; Proteobacteria; Gammaproteobacteria; Xanthomonadales; Xanthomonadaceae; Lysobacter
Average proteome isoelectric point is 6.61
Get precalculated fractions of proteins
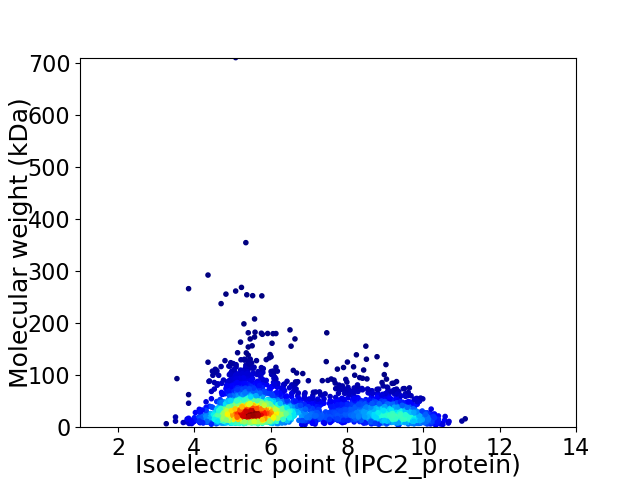
Virtual 2D-PAGE plot for 3253 proteins (isoelectric point calculated using IPC2_protein)
Get csv file with sequences according to given criteria:
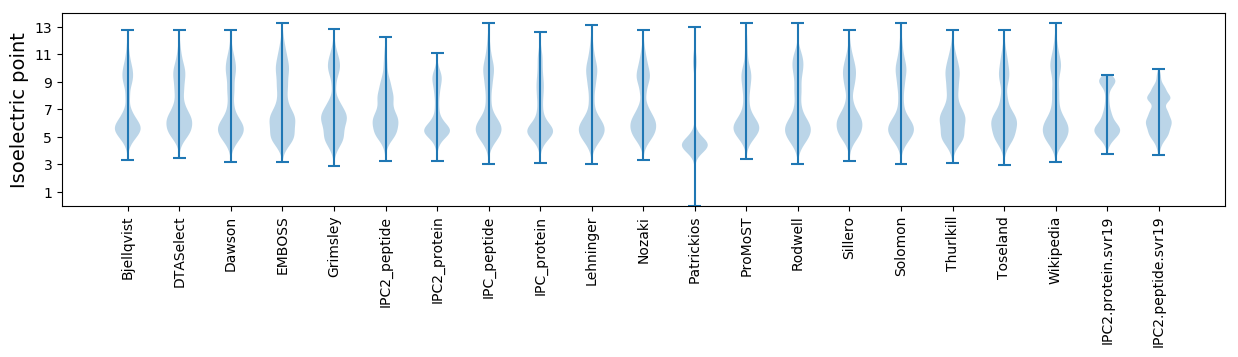
* You can choose from 21 different methods for calculating isoelectric point
Summary statistics related to proteome-wise predictions
Protein with the lowest isoelectric point:
>tr|A0A3M8T0U1|A0A3M8T0U1_9GAMM Serine hydroxymethyltransferase OS=Lysobacter psychrotolerans OX=1327343 GN=glyA PE=3 SV=1
MM1 pKa = 7.46LACNGVPEE9 pKa = 4.39HH10 pKa = 6.61VGAVAASDD18 pKa = 3.06IAEE21 pKa = 4.46EE22 pKa = 4.41FTHH25 pKa = 7.03RR26 pKa = 11.84PWHH29 pKa = 6.01QNVQSTWDD37 pKa = 3.56GSRR40 pKa = 11.84LLLQADD46 pKa = 3.67NDD48 pKa = 3.92YY49 pKa = 11.57DD50 pKa = 4.37SDD52 pKa = 4.0GSALADD58 pKa = 3.61EE59 pKa = 5.24FSDD62 pKa = 5.92AIAACIADD70 pKa = 4.37GFNGSITVEE79 pKa = 4.33SVTALAGAA87 pKa = 4.4
MM1 pKa = 7.46LACNGVPEE9 pKa = 4.39HH10 pKa = 6.61VGAVAASDD18 pKa = 3.06IAEE21 pKa = 4.46EE22 pKa = 4.41FTHH25 pKa = 7.03RR26 pKa = 11.84PWHH29 pKa = 6.01QNVQSTWDD37 pKa = 3.56GSRR40 pKa = 11.84LLLQADD46 pKa = 3.67NDD48 pKa = 3.92YY49 pKa = 11.57DD50 pKa = 4.37SDD52 pKa = 4.0GSALADD58 pKa = 3.61EE59 pKa = 5.24FSDD62 pKa = 5.92AIAACIADD70 pKa = 4.37GFNGSITVEE79 pKa = 4.33SVTALAGAA87 pKa = 4.4
Molecular weight: 9.07 kDa
Isoelectric point according different methods:
Protein with the highest isoelectric point:
>tr|A0A3M8SNG7|A0A3M8SNG7_9GAMM ATP-dependent protease ATPase subunit HslU OS=Lysobacter psychrotolerans OX=1327343 GN=hslU PE=3 SV=1
MM1 pKa = 7.35SAGRR5 pKa = 11.84RR6 pKa = 11.84LALRR10 pKa = 11.84AIVWQAGATALAVLAFLILRR30 pKa = 11.84GAPSALAAAVGGLAVVSAAWVSARR54 pKa = 11.84VALGGGVQPAGVAVGRR70 pKa = 11.84LLLGVVLKK78 pKa = 9.39WVVVIAVLAMGFAGFHH94 pKa = 5.61VPPLPMLVGVLAATLALLPANLLNRR119 pKa = 4.24
MM1 pKa = 7.35SAGRR5 pKa = 11.84RR6 pKa = 11.84LALRR10 pKa = 11.84AIVWQAGATALAVLAFLILRR30 pKa = 11.84GAPSALAAAVGGLAVVSAAWVSARR54 pKa = 11.84VALGGGVQPAGVAVGRR70 pKa = 11.84LLLGVVLKK78 pKa = 9.39WVVVIAVLAMGFAGFHH94 pKa = 5.61VPPLPMLVGVLAATLALLPANLLNRR119 pKa = 4.24
Molecular weight: 11.82 kDa
Isoelectric point according different methods:
Peptides (in silico digests for buttom-up proteomics)
Below you can find in silico digests of the whole proteome with Trypsin, Chymotrypsin, Trypsin+LysC, LysN, ArgC proteases suitable for different mass spec machines.| Try ESI |
 |
|---|
| ChTry ESI |
|
|---|
| ArgC ESI |
|
|---|
| LysN ESI |
|
|---|
| TryLysC ESI |
|
|---|
| Try MALDI |
|
|---|
| ChTry MALDI |
|
|---|
| ArgC MALDI |
|
|---|
| LysN MALDI |
|
|---|
| TryLysC MALDI |
|
|---|
| Try LTQ |
|
|---|
| ChTry LTQ |
|
|---|
| ArgC LTQ |
|
|---|
| LysN LTQ |
|
|---|
| TryLysC LTQ |
|
|---|
| Try MSlow |
|
|---|
| ChTry MSlow |
|
|---|
| ArgC MSlow |
|
|---|
| LysN MSlow |
|
|---|
| TryLysC MSlow |
|
|---|
| Try MShigh |
|
|---|
| ChTry MShigh |
|
|---|
| ArgC MShigh |
|
|---|
| LysN MShigh |
|
|---|
| TryLysC MShigh |
|
|---|
General Statistics
Number of major isoforms |
Number of additional isoforms |
Number of all proteins |
Number of amino acids |
Min. Seq. Length |
Max. Seq. Length |
Avg. Seq. Length |
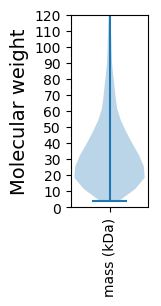
Avg. Mol. Weight |
|---|---|---|---|---|---|---|---|
0 |
1113829 |
38 |
6492 |
342.4 |
37.09 |
Amino acid frequency
Ala |
Cys |
Asp |
Glu |
Phe |
Gly |
His |
Ile |
Lys |
Leu |
|---|---|---|---|---|---|---|---|---|---|
13.139 ± 0.061 | 0.868 ± 0.012 |
6.077 ± 0.034 | 5.107 ± 0.042 |
3.339 ± 0.025 | 8.734 ± 0.044 |
2.331 ± 0.022 | 3.977 ± 0.027 |
2.459 ± 0.036 | 10.573 ± 0.059 |
Met |
Asn |
Gln |
Pro |
Arg |
Ser |
Thr |
Val |
Trp |
Tyr |
|---|---|---|---|---|---|---|---|---|---|
2.079 ± 0.022 | 2.53 ± 0.031 |
5.418 ± 0.033 | 3.618 ± 0.03 |
7.838 ± 0.052 | 5.368 ± 0.036 |
5.107 ± 0.046 | 7.608 ± 0.032 |
1.537 ± 0.02 | 2.296 ± 0.025 |
Most of the basic statistics you can see at this page can be downloaded from this CSV file
See this proteome in:

Proteome-pI is available under Creative Commons Attribution-NoDerivs license, for more details see here
| Reference: Kozlowski LP. Proteome-pI 2.0: Proteome Isoelectric Point Database Update. Nucleic Acids Res. 2021, doi: 10.1093/nar/gkab944 | Contact: Lukasz P. Kozlowski |