Abiotrophia defectiva ATCC 49176
Taxonomy: cellular organisms; Bacteria; Terrabacteria group; Firmicutes; Bacilli; Lactobacillales; Aerococcaceae; Abiotrophia; Abiotrophia defectiva
Average proteome isoelectric point is 6.19
Get precalculated fractions of proteins
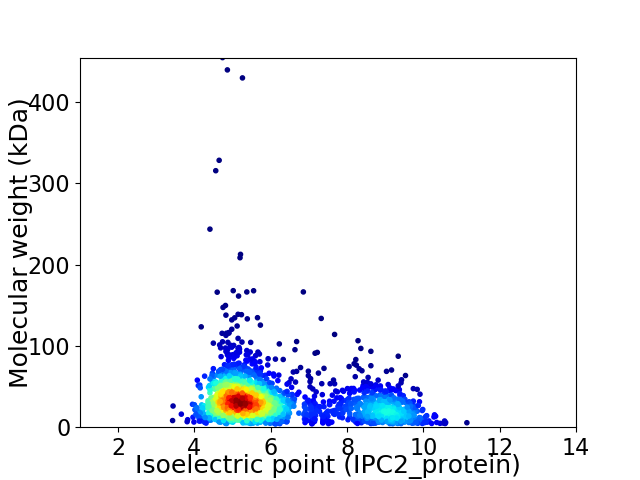
Virtual 2D-PAGE plot for 1943 proteins (isoelectric point calculated using IPC2_protein)
Get csv file with sequences according to given criteria:
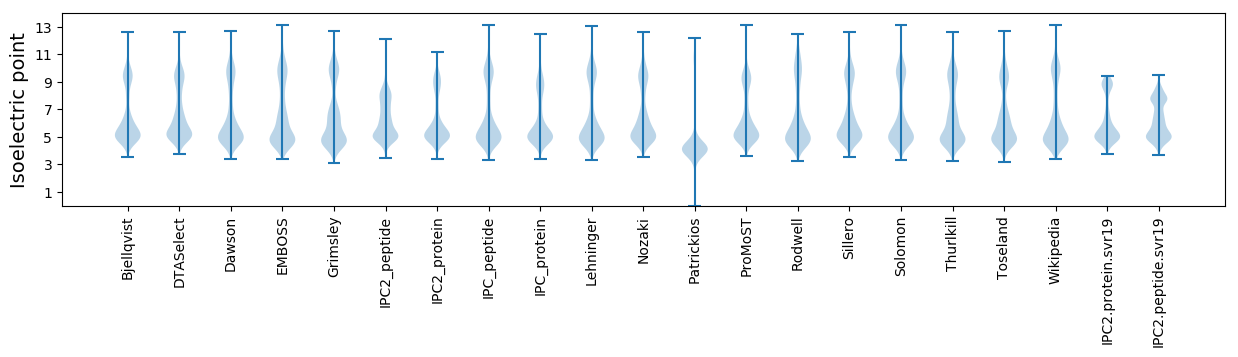
* You can choose from 21 different methods for calculating isoelectric point
Summary statistics related to proteome-wise predictions
Protein with the lowest isoelectric point:
>tr|W1Q3S0|W1Q3S0_ABIDE Uncharacterized protein OS=Abiotrophia defectiva ATCC 49176 OX=592010 GN=GCWU000182_000871 PE=4 SV=1
MM1 pKa = 7.51NPYY4 pKa = 10.06QDD6 pKa = 5.56YY7 pKa = 9.72VQDD10 pKa = 3.73WQAQAPDD17 pKa = 4.1YY18 pKa = 10.51PSQALLQVASDD29 pKa = 4.81LYY31 pKa = 10.18QQQEE35 pKa = 3.82DD36 pKa = 3.95RR37 pKa = 11.84LRR39 pKa = 11.84QLEE42 pKa = 4.09GQLDD46 pKa = 3.82GSMWSPKK53 pKa = 10.07DD54 pKa = 3.3WQNN57 pKa = 3.08
MM1 pKa = 7.51NPYY4 pKa = 10.06QDD6 pKa = 5.56YY7 pKa = 9.72VQDD10 pKa = 3.73WQAQAPDD17 pKa = 4.1YY18 pKa = 10.51PSQALLQVASDD29 pKa = 4.81LYY31 pKa = 10.18QQQEE35 pKa = 3.82DD36 pKa = 3.95RR37 pKa = 11.84LRR39 pKa = 11.84QLEE42 pKa = 4.09GQLDD46 pKa = 3.82GSMWSPKK53 pKa = 10.07DD54 pKa = 3.3WQNN57 pKa = 3.08
Molecular weight: 6.77 kDa
Isoelectric point according different methods:
Protein with the highest isoelectric point:
>tr|W1Q4G4|W1Q4G4_ABIDE LemA family protein OS=Abiotrophia defectiva ATCC 49176 OX=592010 GN=GCWU000182_000472 PE=3 SV=1
MM1 pKa = 7.36KK2 pKa = 9.43RR3 pKa = 11.84TYY5 pKa = 9.67QPKK8 pKa = 9.36KK9 pKa = 7.48RR10 pKa = 11.84TRR12 pKa = 11.84KK13 pKa = 9.06KK14 pKa = 8.41VHH16 pKa = 5.85GFRR19 pKa = 11.84KK20 pKa = 10.01RR21 pKa = 11.84MSTKK25 pKa = 10.14NGRR28 pKa = 11.84NVLKK32 pKa = 10.51RR33 pKa = 11.84RR34 pKa = 11.84RR35 pKa = 11.84QKK37 pKa = 10.23GRR39 pKa = 11.84KK40 pKa = 8.92RR41 pKa = 11.84LAQQ44 pKa = 3.57
MM1 pKa = 7.36KK2 pKa = 9.43RR3 pKa = 11.84TYY5 pKa = 9.67QPKK8 pKa = 9.36KK9 pKa = 7.48RR10 pKa = 11.84TRR12 pKa = 11.84KK13 pKa = 9.06KK14 pKa = 8.41VHH16 pKa = 5.85GFRR19 pKa = 11.84KK20 pKa = 10.01RR21 pKa = 11.84MSTKK25 pKa = 10.14NGRR28 pKa = 11.84NVLKK32 pKa = 10.51RR33 pKa = 11.84RR34 pKa = 11.84RR35 pKa = 11.84QKK37 pKa = 10.23GRR39 pKa = 11.84KK40 pKa = 8.92RR41 pKa = 11.84LAQQ44 pKa = 3.57
Molecular weight: 5.49 kDa
Isoelectric point according different methods:
Peptides (in silico digests for buttom-up proteomics)
Below you can find in silico digests of the whole proteome with Trypsin, Chymotrypsin, Trypsin+LysC, LysN, ArgC proteases suitable for different mass spec machines.| Try ESI |
 |
|---|
| ChTry ESI |
|
|---|
| ArgC ESI |
|
|---|
| LysN ESI |
|
|---|
| TryLysC ESI |
|
|---|
| Try MALDI |
|
|---|
| ChTry MALDI |
|
|---|
| ArgC MALDI |
|
|---|
| LysN MALDI |
|
|---|
| TryLysC MALDI |
|
|---|
| Try LTQ |
|
|---|
| ChTry LTQ |
|
|---|
| ArgC LTQ |
|
|---|
| LysN LTQ |
|
|---|
| TryLysC LTQ |
|
|---|
| Try MSlow |
|
|---|
| ChTry MSlow |
|
|---|
| ArgC MSlow |
|
|---|
| LysN MSlow |
|
|---|
| TryLysC MSlow |
|
|---|
| Try MShigh |
|
|---|
| ChTry MShigh |
|
|---|
| ArgC MShigh |
|
|---|
| LysN MShigh |
|
|---|
| TryLysC MShigh |
|
|---|
General Statistics
Number of major isoforms |
Number of additional isoforms |
Number of all proteins |
Number of amino acids |
Min. Seq. Length |
Max. Seq. Length |
Avg. Seq. Length |
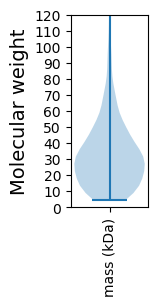
Avg. Mol. Weight |
|---|---|---|---|---|---|---|---|
0 |
613071 |
39 |
4231 |
315.5 |
35.16 |
Amino acid frequency
Ala |
Cys |
Asp |
Glu |
Phe |
Gly |
His |
Ile |
Lys |
Leu |
|---|---|---|---|---|---|---|---|---|---|
8.891 ± 0.116 | 0.6 ± 0.018 |
5.67 ± 0.054 | 6.366 ± 0.057 |
3.966 ± 0.045 | 6.824 ± 0.063 |
2.073 ± 0.035 | 6.025 ± 0.061 |
5.481 ± 0.062 | 10.589 ± 0.112 |
Met |
Asn |
Gln |
Pro |
Arg |
Ser |
Thr |
Val |
Trp |
Tyr |
|---|---|---|---|---|---|---|---|---|---|
2.399 ± 0.031 | 3.801 ± 0.048 |
3.928 ± 0.058 | 5.455 ± 0.068 |
4.461 ± 0.049 | 5.961 ± 0.056 |
5.414 ± 0.091 | 7.201 ± 0.068 |
1.112 ± 0.025 | 3.781 ± 0.038 |
Most of the basic statistics you can see at this page can be downloaded from this CSV file
See this proteome in:

Proteome-pI is available under Creative Commons Attribution-NoDerivs license, for more details see here
| Reference: Kozlowski LP. Proteome-pI 2.0: Proteome Isoelectric Point Database Update. Nucleic Acids Res. 2021, doi: 10.1093/nar/gkab944 | Contact: Lukasz P. Kozlowski |