Mycoplasma anatis 1340
Taxonomy: cellular organisms; Bacteria; Terrabacteria group; Tenericutes; Mollicutes; Mycoplasmatales; Mycoplasmataceae; Mycoplasmopsis; Mycoplasmopsis anatis
Average proteome isoelectric point is 7.22
Get precalculated fractions of proteins
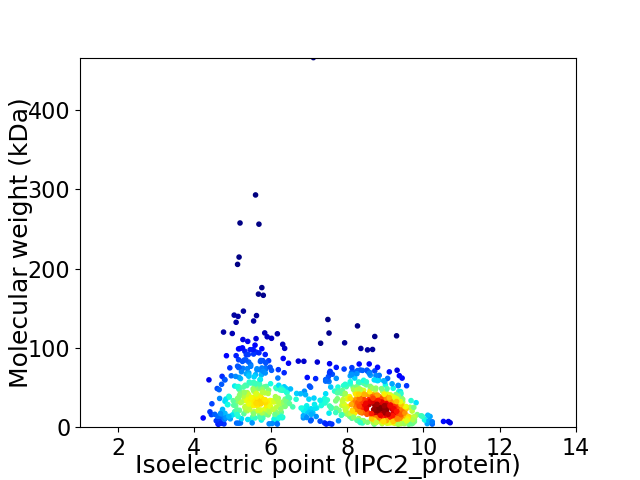
Virtual 2D-PAGE plot for 803 proteins (isoelectric point calculated using IPC2_protein)
Get csv file with sequences according to given criteria:
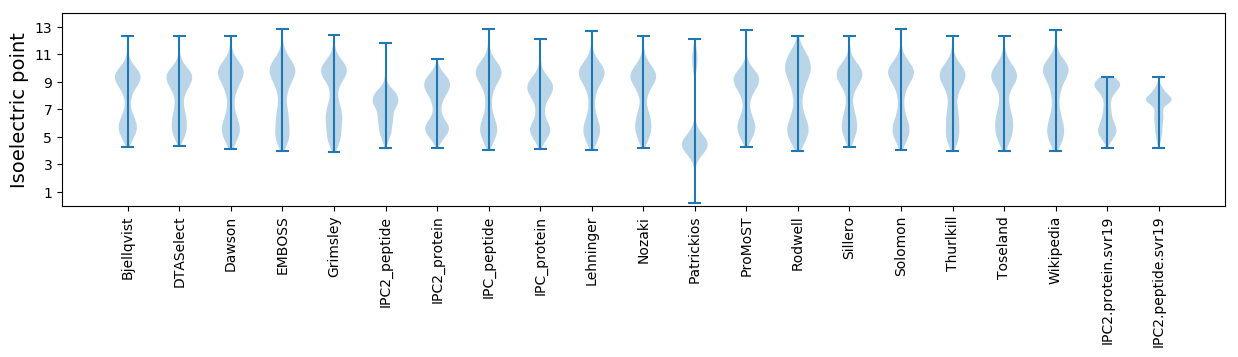
* You can choose from 21 different methods for calculating isoelectric point
Summary statistics related to proteome-wise predictions
Protein with the lowest isoelectric point:
>tr|F9QD64|F9QD64_9MOLU Adenine phosphoribosyltransferase OS=Mycoplasma anatis 1340 OX=1034808 GN=apt PE=3 SV=1
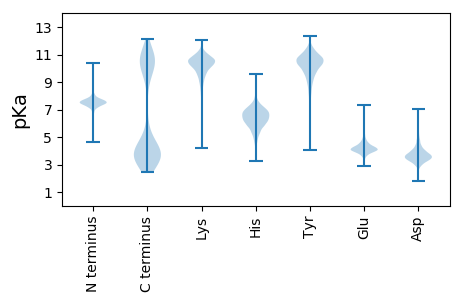
MM1 pKa = 7.66KK2 pKa = 10.58NNNNDD7 pKa = 2.73IYY9 pKa = 10.64ICGGLSIYY17 pKa = 10.45LQTINIADD25 pKa = 3.99EE26 pKa = 4.81VILSVISSKK35 pKa = 11.43YY36 pKa = 9.95EE37 pKa = 3.59GDD39 pKa = 3.04IKK41 pKa = 10.88IFF43 pKa = 3.65
MM1 pKa = 7.66KK2 pKa = 10.58NNNNDD7 pKa = 2.73IYY9 pKa = 10.64ICGGLSIYY17 pKa = 10.45LQTINIADD25 pKa = 3.99EE26 pKa = 4.81VILSVISSKK35 pKa = 11.43YY36 pKa = 9.95EE37 pKa = 3.59GDD39 pKa = 3.04IKK41 pKa = 10.88IFF43 pKa = 3.65
Molecular weight: 4.82 kDa
Isoelectric point according different methods:
Protein with the highest isoelectric point:
>tr|F9QD38|F9QD38_9MOLU 50S ribosomal protein L14 OS=Mycoplasma anatis 1340 OX=1034808 GN=rplN PE=3 SV=1
MM1 pKa = 7.34ARR3 pKa = 11.84KK4 pKa = 9.46ALIEE8 pKa = 3.93KK9 pKa = 10.2AKK11 pKa = 10.03RR12 pKa = 11.84HH13 pKa = 5.81PKK15 pKa = 10.03FSTRR19 pKa = 11.84AYY21 pKa = 8.48TRR23 pKa = 11.84CEE25 pKa = 3.78LCGRR29 pKa = 11.84PHH31 pKa = 6.83SVLRR35 pKa = 11.84KK36 pKa = 9.37YY37 pKa = 10.29KK38 pKa = 9.48ICRR41 pKa = 11.84ICFRR45 pKa = 11.84GLANEE50 pKa = 4.21GKK52 pKa = 10.0IPGMKK57 pKa = 9.27KK58 pKa = 10.56ASWW61 pKa = 3.19
MM1 pKa = 7.34ARR3 pKa = 11.84KK4 pKa = 9.46ALIEE8 pKa = 3.93KK9 pKa = 10.2AKK11 pKa = 10.03RR12 pKa = 11.84HH13 pKa = 5.81PKK15 pKa = 10.03FSTRR19 pKa = 11.84AYY21 pKa = 8.48TRR23 pKa = 11.84CEE25 pKa = 3.78LCGRR29 pKa = 11.84PHH31 pKa = 6.83SVLRR35 pKa = 11.84KK36 pKa = 9.37YY37 pKa = 10.29KK38 pKa = 9.48ICRR41 pKa = 11.84ICFRR45 pKa = 11.84GLANEE50 pKa = 4.21GKK52 pKa = 10.0IPGMKK57 pKa = 9.27KK58 pKa = 10.56ASWW61 pKa = 3.19
Molecular weight: 7.09 kDa
Isoelectric point according different methods:
Peptides (in silico digests for buttom-up proteomics)
Below you can find in silico digests of the whole proteome with Trypsin, Chymotrypsin, Trypsin+LysC, LysN, ArgC proteases suitable for different mass spec machines.| Try ESI |
 |
|---|
| ChTry ESI |
|
|---|
| ArgC ESI |
|
|---|
| LysN ESI |
|
|---|
| TryLysC ESI |
|
|---|
| Try MALDI |
|
|---|
| ChTry MALDI |
|
|---|
| ArgC MALDI |
|
|---|
| LysN MALDI |
|
|---|
| TryLysC MALDI |
|
|---|
| Try LTQ |
|
|---|
| ChTry LTQ |
|
|---|
| ArgC LTQ |
|
|---|
| LysN LTQ |
|
|---|
| TryLysC LTQ |
|
|---|
| Try MSlow |
|
|---|
| ChTry MSlow |
|
|---|
| ArgC MSlow |
|
|---|
| LysN MSlow |
|
|---|
| TryLysC MSlow |
|
|---|
| Try MShigh |
|
|---|
| ChTry MShigh |
|
|---|
| ArgC MShigh |
|
|---|
| LysN MShigh |
|
|---|
| TryLysC MShigh |
|
|---|
General Statistics
Number of major isoforms |
Number of additional isoforms |
Number of all proteins |
Number of amino acids |
Min. Seq. Length |
Max. Seq. Length |
Avg. Seq. Length |
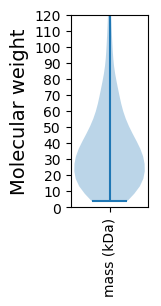
Avg. Mol. Weight |
|---|---|---|---|---|---|---|---|
0 |
275923 |
30 |
4077 |
343.6 |
39.53 |
Amino acid frequency
Ala |
Cys |
Asp |
Glu |
Phe |
Gly |
His |
Ile |
Lys |
Leu |
|---|---|---|---|---|---|---|---|---|---|
4.493 ± 0.088 | 0.577 ± 0.025 |
5.369 ± 0.062 | 7.062 ± 0.101 |
5.406 ± 0.09 | 4.363 ± 0.088 |
1.321 ± 0.03 | 10.125 ± 0.115 |
10.119 ± 0.086 | 9.556 ± 0.079 |
Met |
Asn |
Gln |
Pro |
Arg |
Ser |
Thr |
Val |
Trp |
Tyr |
|---|---|---|---|---|---|---|---|---|---|
1.762 ± 0.04 | 8.542 ± 0.147 |
2.441 ± 0.05 | 3.001 ± 0.055 |
2.961 ± 0.052 | 7.014 ± 0.069 |
5.097 ± 0.061 | 5.569 ± 0.083 |
0.893 ± 0.028 | 4.33 ± 0.075 |
Most of the basic statistics you can see at this page can be downloaded from this CSV file
See this proteome in:

Proteome-pI is available under Creative Commons Attribution-NoDerivs license, for more details see here
| Reference: Kozlowski LP. Proteome-pI 2.0: Proteome Isoelectric Point Database Update. Nucleic Acids Res. 2021, doi: 10.1093/nar/gkab944 | Contact: Lukasz P. Kozlowski |