Schlumbergera virus X
Taxonomy: Viruses; Riboviria; Orthornavirae; Kitrinoviricota; Alsuviricetes; Tymovirales; Alphaflexiviridae; Potexvirus
Average proteome isoelectric point is 6.79
Get precalculated fractions of proteins
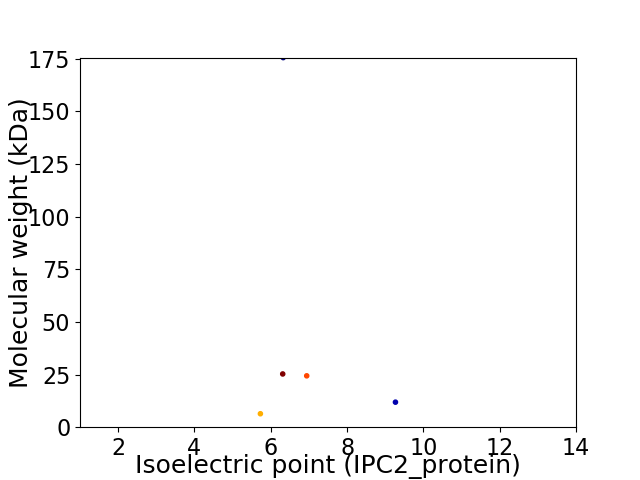
Virtual 2D-PAGE plot for 5 proteins (isoelectric point calculated using IPC2_protein)
Get csv file with sequences according to given criteria:
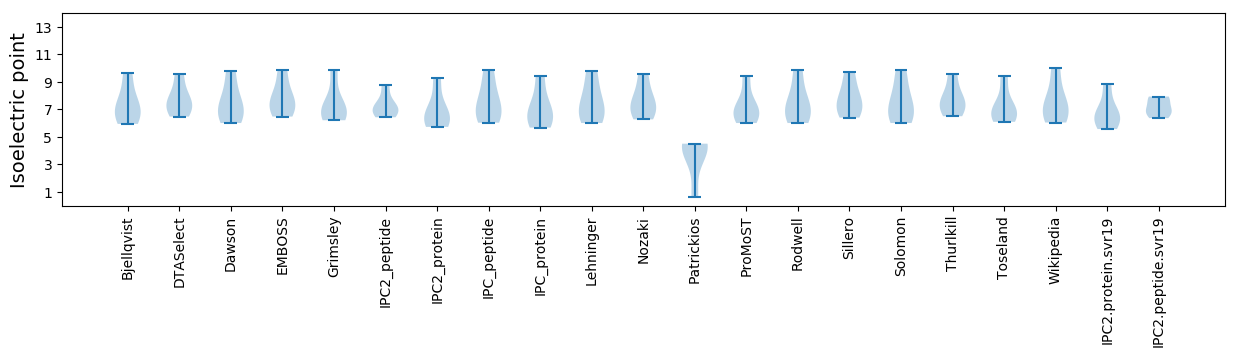
* You can choose from 21 different methods for calculating isoelectric point
Summary statistics related to proteome-wise predictions
Protein with the lowest isoelectric point:
>tr|Q6UNI9|Q6UNI9_9VIRU Triple gene block protein 2 OS=Schlumbergera virus X OX=253700 PE=4 SV=1
MM1 pKa = 7.33FLLYY5 pKa = 10.7SLIGVVVGIAIIVVLNTLNSPSCTIILNGHH35 pKa = 4.78STIIQGCTQLSNLDD49 pKa = 3.83SVIEE53 pKa = 4.01ALNHH57 pKa = 5.79RR58 pKa = 11.84LSS60 pKa = 3.5
MM1 pKa = 7.33FLLYY5 pKa = 10.7SLIGVVVGIAIIVVLNTLNSPSCTIILNGHH35 pKa = 4.78STIIQGCTQLSNLDD49 pKa = 3.83SVIEE53 pKa = 4.01ALNHH57 pKa = 5.79RR58 pKa = 11.84LSS60 pKa = 3.5
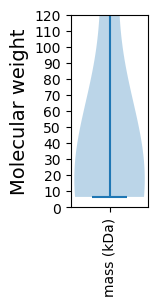
Molecular weight: 6.39 kDa
Isoelectric point according different methods:
Protein with the highest isoelectric point:
>tr|Q6UNJ0|Q6UNJ0_9VIRU Triple gene block protein 1 OS=Schlumbergera virus X OX=253700 PE=4 SV=1
MM1 pKa = 7.4SGAPIHH7 pKa = 6.13LTPPPDD13 pKa = 3.26QTKK16 pKa = 10.61VIFPLTVGLGLTLVVYY32 pKa = 10.64SLTRR36 pKa = 11.84STLPHH41 pKa = 6.78VGDD44 pKa = 4.02STHH47 pKa = 6.49SLPHH51 pKa = 6.23GGTYY55 pKa = 9.76RR56 pKa = 11.84DD57 pKa = 3.57GTKK60 pKa = 10.22SVNYY64 pKa = 7.17YY65 pKa = 10.2QPSHH69 pKa = 6.62PVSNHH74 pKa = 5.52LPLIFVLGLIVAIYY88 pKa = 10.7VSTLFSNRR96 pKa = 11.84SRR98 pKa = 11.84GRR100 pKa = 11.84HH101 pKa = 5.62CNHH104 pKa = 6.97CGAKK108 pKa = 9.82HH109 pKa = 5.11AA110 pKa = 4.94
MM1 pKa = 7.4SGAPIHH7 pKa = 6.13LTPPPDD13 pKa = 3.26QTKK16 pKa = 10.61VIFPLTVGLGLTLVVYY32 pKa = 10.64SLTRR36 pKa = 11.84STLPHH41 pKa = 6.78VGDD44 pKa = 4.02STHH47 pKa = 6.49SLPHH51 pKa = 6.23GGTYY55 pKa = 9.76RR56 pKa = 11.84DD57 pKa = 3.57GTKK60 pKa = 10.22SVNYY64 pKa = 7.17YY65 pKa = 10.2QPSHH69 pKa = 6.62PVSNHH74 pKa = 5.52LPLIFVLGLIVAIYY88 pKa = 10.7VSTLFSNRR96 pKa = 11.84SRR98 pKa = 11.84GRR100 pKa = 11.84HH101 pKa = 5.62CNHH104 pKa = 6.97CGAKK108 pKa = 9.82HH109 pKa = 5.11AA110 pKa = 4.94
Molecular weight: 11.89 kDa
Isoelectric point according different methods:
Peptides (in silico digests for buttom-up proteomics)
Below you can find in silico digests of the whole proteome with Trypsin, Chymotrypsin, Trypsin+LysC, LysN, ArgC proteases suitable for different mass spec machines.| Try ESI |
 |
|---|
| ChTry ESI |
|
|---|
| ArgC ESI |
|
|---|
| LysN ESI |
|
|---|
| TryLysC ESI |
|
|---|
| Try MALDI |
|
|---|
| ChTry MALDI |
|
|---|
| ArgC MALDI |
|
|---|
| LysN MALDI |
|
|---|
| TryLysC MALDI |
|
|---|
| Try LTQ |
|
|---|
| ChTry LTQ |
|
|---|
| ArgC LTQ |
|
|---|
| LysN LTQ |
|
|---|
| TryLysC LTQ |
|
|---|
| Try MSlow |
|
|---|
| ChTry MSlow |
|
|---|
| ArgC MSlow |
|
|---|
| LysN MSlow |
|
|---|
| TryLysC MSlow |
|
|---|
| Try MShigh |
|
|---|
| ChTry MShigh |
|
|---|
| ArgC MShigh |
|
|---|
| LysN MShigh |
|
|---|
| TryLysC MShigh |
|
|---|
General Statistics
Number of major isoforms |
Number of additional isoforms |
Number of all proteins |
Number of amino acids |
Min. Seq. Length |
Max. Seq. Length |
Avg. Seq. Length |
Avg. Mol. Weight |
|---|---|---|---|---|---|---|---|
0 |
2169 |
60 |
1545 |
433.8 |
48.71 |
Amino acid frequency
Ala |
Cys |
Asp |
Glu |
Phe |
Gly |
His |
Ile |
Lys |
Leu |
|---|---|---|---|---|---|---|---|---|---|
7.1 ± 0.739 | 1.291 ± 0.234 |
4.518 ± 0.772 | 5.994 ± 1.201 |
4.472 ± 0.636 | 5.118 ± 0.573 |
3.642 ± 0.743 | 5.671 ± 0.795 |
6.132 ± 1.23 | 9.959 ± 1.193 |
Met |
Asn |
Gln |
Pro |
Arg |
Ser |
Thr |
Val |
Trp |
Tyr |
|---|---|---|---|---|---|---|---|---|---|
1.982 ± 0.45 | 4.518 ± 0.639 |
6.455 ± 0.512 | 4.61 ± 0.359 |
4.195 ± 0.258 | 7.423 ± 1.252 |
7.146 ± 0.386 | 5.486 ± 0.88 |
1.199 ± 0.314 | 3.089 ± 0.227 |
Most of the basic statistics you can see at this page can be downloaded from this CSV file
See this proteome in:

Proteome-pI is available under Creative Commons Attribution-NoDerivs license, for more details see here
| Reference: Kozlowski LP. Proteome-pI 2.0: Proteome Isoelectric Point Database Update. Nucleic Acids Res. 2021, doi: 10.1093/nar/gkab944 | Contact: Lukasz P. Kozlowski |