candidate division TM7 genomosp. GTL1
Taxonomy: cellular organisms; Bacteria; Bacteria incertae sedis; Bacteria candidate phyla; Candidatus Saccharibacteria
Average proteome isoelectric point is 6.82
Get precalculated fractions of proteins
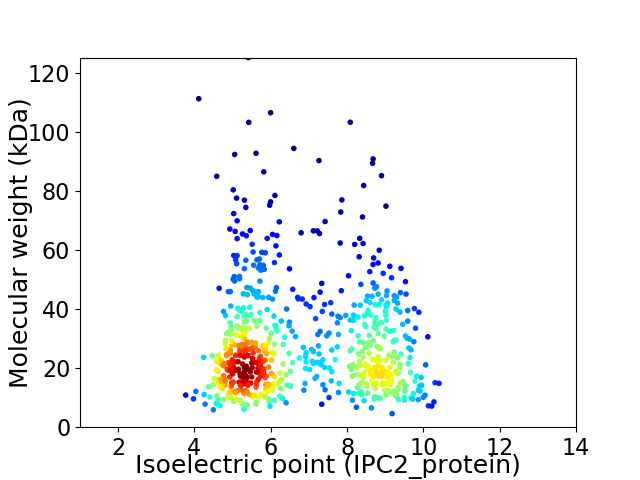
Virtual 2D-PAGE plot for 670 proteins (isoelectric point calculated using IPC2_protein)
Get csv file with sequences according to given criteria:
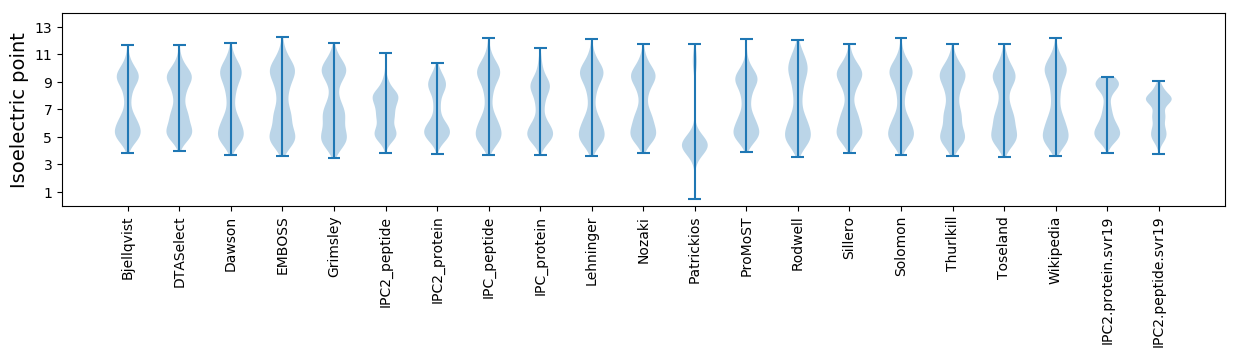
* You can choose from 21 different methods for calculating isoelectric point
Summary statistics related to proteome-wise predictions
Protein with the lowest isoelectric point:
>tr|A5KSH5|A5KSH5_9BACT Uncharacterized protein OS=candidate division TM7 genomosp. GTL1 OX=443342 GN=TM7_0245 PE=4 SV=1
MM1 pKa = 7.6AAMDD5 pKa = 3.84EE6 pKa = 4.46FANVLLPISIDD17 pKa = 3.54AQNGLAGASAAPTLPITTATANDD40 pKa = 4.28LLIGMVGVEE49 pKa = 4.29SDD51 pKa = 3.51SADD54 pKa = 3.36TYY56 pKa = 11.42TEE58 pKa = 4.05DD59 pKa = 5.35TIHH62 pKa = 6.04QWTSLTRR69 pKa = 11.84IGTTGGASNTNVTVNGVYY87 pKa = 10.08RR88 pKa = 11.84AVGSTGTYY96 pKa = 9.31TYY98 pKa = 11.14APTLGVSATWTEE110 pKa = 3.48FLIAYY115 pKa = 7.6KK116 pKa = 10.73ASS118 pKa = 3.29
MM1 pKa = 7.6AAMDD5 pKa = 3.84EE6 pKa = 4.46FANVLLPISIDD17 pKa = 3.54AQNGLAGASAAPTLPITTATANDD40 pKa = 4.28LLIGMVGVEE49 pKa = 4.29SDD51 pKa = 3.51SADD54 pKa = 3.36TYY56 pKa = 11.42TEE58 pKa = 4.05DD59 pKa = 5.35TIHH62 pKa = 6.04QWTSLTRR69 pKa = 11.84IGTTGGASNTNVTVNGVYY87 pKa = 10.08RR88 pKa = 11.84AVGSTGTYY96 pKa = 9.31TYY98 pKa = 11.14APTLGVSATWTEE110 pKa = 3.48FLIAYY115 pKa = 7.6KK116 pKa = 10.73ASS118 pKa = 3.29
Molecular weight: 12.15 kDa
Isoelectric point according different methods:
Protein with the highest isoelectric point:
>tr|A5KTI7|A5KTI7_9BACT Glyceraldehyde-3-phosphate dehydrogenase type I OS=candidate division TM7 genomosp. GTL1 OX=443342 GN=TM7_0629 PE=3 SV=1
MM1 pKa = 7.54TSACTNSILLYY12 pKa = 9.76CSNRR16 pKa = 11.84FGQRR20 pKa = 11.84RR21 pKa = 11.84IMANFEE27 pKa = 4.14LEE29 pKa = 4.35ANGHH33 pKa = 5.9HH34 pKa = 5.77VTTFKK39 pKa = 11.0AINTNQFWSGVRR51 pKa = 11.84KK52 pKa = 7.95NTPPGAKK59 pKa = 9.27NVQIFHH65 pKa = 6.9GNTLVAQGLSLRR77 pKa = 11.84VSEE80 pKa = 4.19RR81 pKa = 11.84QFRR84 pKa = 11.84EE85 pKa = 3.73ILVSS89 pKa = 3.48
MM1 pKa = 7.54TSACTNSILLYY12 pKa = 9.76CSNRR16 pKa = 11.84FGQRR20 pKa = 11.84RR21 pKa = 11.84IMANFEE27 pKa = 4.14LEE29 pKa = 4.35ANGHH33 pKa = 5.9HH34 pKa = 5.77VTTFKK39 pKa = 11.0AINTNQFWSGVRR51 pKa = 11.84KK52 pKa = 7.95NTPPGAKK59 pKa = 9.27NVQIFHH65 pKa = 6.9GNTLVAQGLSLRR77 pKa = 11.84VSEE80 pKa = 4.19RR81 pKa = 11.84QFRR84 pKa = 11.84EE85 pKa = 3.73ILVSS89 pKa = 3.48
Molecular weight: 10.03 kDa
Isoelectric point according different methods:
Peptides (in silico digests for buttom-up proteomics)
Below you can find in silico digests of the whole proteome with Trypsin, Chymotrypsin, Trypsin+LysC, LysN, ArgC proteases suitable for different mass spec machines.| Try ESI |
 |
|---|
| ChTry ESI |
|
|---|
| ArgC ESI |
|
|---|
| LysN ESI |
|
|---|
| TryLysC ESI |
|
|---|
| Try MALDI |
|
|---|
| ChTry MALDI |
|
|---|
| ArgC MALDI |
|
|---|
| LysN MALDI |
|
|---|
| TryLysC MALDI |
|
|---|
| Try LTQ |
|
|---|
| ChTry LTQ |
|
|---|
| ArgC LTQ |
|
|---|
| LysN LTQ |
|
|---|
| TryLysC LTQ |
|
|---|
| Try MSlow |
|
|---|
| ChTry MSlow |
|
|---|
| ArgC MSlow |
|
|---|
| LysN MSlow |
|
|---|
| TryLysC MSlow |
|
|---|
| Try MShigh |
|
|---|
| ChTry MShigh |
|
|---|
| ArgC MShigh |
|
|---|
| LysN MShigh |
|
|---|
| TryLysC MShigh |
|
|---|
General Statistics
Number of major isoforms |
Number of additional isoforms |
Number of all proteins |
Number of amino acids |
Min. Seq. Length |
Max. Seq. Length |
Avg. Seq. Length |
Avg. Mol. Weight |
|---|---|---|---|---|---|---|---|
0 |
178123 |
44 |
1093 |
265.9 |
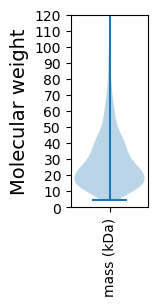
29.53 |
Amino acid frequency
Ala |
Cys |
Asp |
Glu |
Phe |
Gly |
His |
Ile |
Lys |
Leu |
|---|---|---|---|---|---|---|---|---|---|
8.657 ± 0.091 | 0.711 ± 0.025 |
5.423 ± 0.069 | 5.969 ± 0.091 |
4.17 ± 0.058 | 7.212 ± 0.104 |
2.067 ± 0.052 | 6.631 ± 0.07 |
5.848 ± 0.093 | 9.598 ± 0.116 |
Met |
Asn |
Gln |
Pro |
Arg |
Ser |
Thr |
Val |
Trp |
Tyr |
|---|---|---|---|---|---|---|---|---|---|
2.166 ± 0.038 | 4.018 ± 0.064 |
4.272 ± 0.06 | 3.731 ± 0.058 |
5.474 ± 0.076 | 6.256 ± 0.082 |
6.246 ± 0.112 | 7.055 ± 0.08 |
1.233 ± 0.042 | 3.239 ± 0.059 |
Most of the basic statistics you can see at this page can be downloaded from this CSV file
See this proteome in:

Proteome-pI is available under Creative Commons Attribution-NoDerivs license, for more details see here
| Reference: Kozlowski LP. Proteome-pI 2.0: Proteome Isoelectric Point Database Update. Nucleic Acids Res. 2021, doi: 10.1093/nar/gkab944 | Contact: Lukasz P. Kozlowski |