Mycobacterium virus Avani
Taxonomy: Viruses; Duplodnaviria; Heunggongvirae; Uroviricota; Caudoviricetes; Caudovirales; Siphoviridae; Avanivirus
Average proteome isoelectric point is 6.1
Get precalculated fractions of proteins
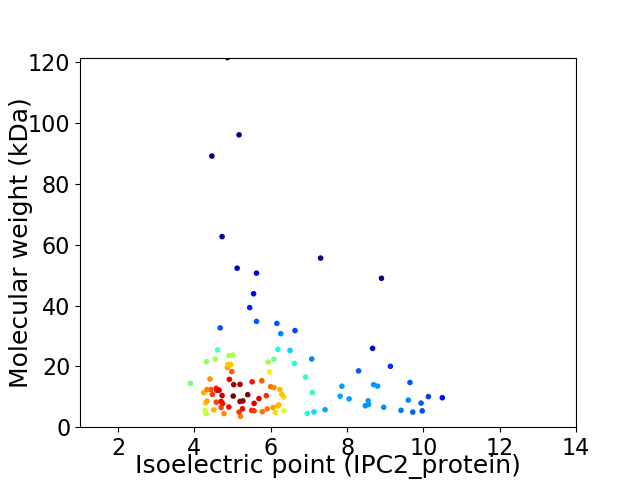
Virtual 2D-PAGE plot for 107 proteins (isoelectric point calculated using IPC2_protein)
Get csv file with sequences according to given criteria:
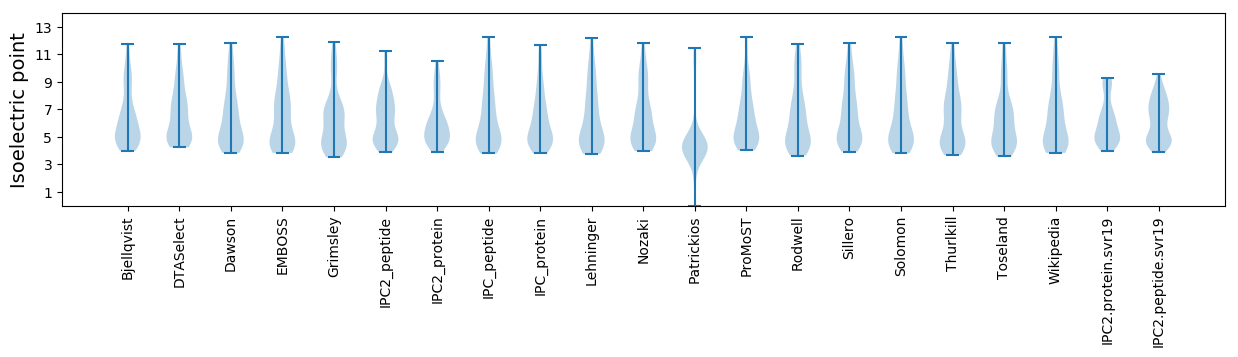
* You can choose from 21 different methods for calculating isoelectric point
Summary statistics related to proteome-wise predictions
Protein with the lowest isoelectric point:
>tr|I3WWV8|I3WWV8_9CAUD Uncharacterized protein OS=Mycobacterium virus Avani OX=1168594 GN=81 PE=4 SV=1
MM1 pKa = 7.71SDD3 pKa = 5.03CLLCDD8 pKa = 3.92HH9 pKa = 7.15PRR11 pKa = 11.84STHH14 pKa = 5.11TPQCRR19 pKa = 11.84TRR21 pKa = 11.84LGVDD25 pKa = 2.95ADD27 pKa = 3.66DD28 pKa = 3.59MTRR31 pKa = 11.84YY32 pKa = 6.71TQCLCPGFEE41 pKa = 4.05GTEE44 pKa = 4.14DD45 pKa = 3.92GEE47 pKa = 4.23EE48 pKa = 4.1DD49 pKa = 3.26
MM1 pKa = 7.71SDD3 pKa = 5.03CLLCDD8 pKa = 3.92HH9 pKa = 7.15PRR11 pKa = 11.84STHH14 pKa = 5.11TPQCRR19 pKa = 11.84TRR21 pKa = 11.84LGVDD25 pKa = 2.95ADD27 pKa = 3.66DD28 pKa = 3.59MTRR31 pKa = 11.84YY32 pKa = 6.71TQCLCPGFEE41 pKa = 4.05GTEE44 pKa = 4.14DD45 pKa = 3.92GEE47 pKa = 4.23EE48 pKa = 4.1DD49 pKa = 3.26
Molecular weight: 5.51 kDa
Isoelectric point according different methods:
Protein with the highest isoelectric point:
>tr|I3WWX7|I3WWX7_9CAUD Uncharacterized protein OS=Mycobacterium virus Avani OX=1168594 GN=102 PE=4 SV=1
MM1 pKa = 6.68TQRR4 pKa = 11.84KK5 pKa = 9.5GGFDD9 pKa = 4.35WIRR12 pKa = 11.84STYY15 pKa = 9.77RR16 pKa = 11.84VPAKK20 pKa = 10.02RR21 pKa = 11.84GMRR24 pKa = 11.84VVFDD28 pKa = 3.72GRR30 pKa = 11.84PGRR33 pKa = 11.84ILSVDD38 pKa = 3.4GPYY41 pKa = 11.37LMLHH45 pKa = 6.91LDD47 pKa = 3.96SDD49 pKa = 4.41PKK51 pKa = 10.37NLRR54 pKa = 11.84TRR56 pKa = 11.84VHH58 pKa = 5.46PTWRR62 pKa = 11.84MEE64 pKa = 3.91YY65 pKa = 10.61LPP67 pKa = 4.85
MM1 pKa = 6.68TQRR4 pKa = 11.84KK5 pKa = 9.5GGFDD9 pKa = 4.35WIRR12 pKa = 11.84STYY15 pKa = 9.77RR16 pKa = 11.84VPAKK20 pKa = 10.02RR21 pKa = 11.84GMRR24 pKa = 11.84VVFDD28 pKa = 3.72GRR30 pKa = 11.84PGRR33 pKa = 11.84ILSVDD38 pKa = 3.4GPYY41 pKa = 11.37LMLHH45 pKa = 6.91LDD47 pKa = 3.96SDD49 pKa = 4.41PKK51 pKa = 10.37NLRR54 pKa = 11.84TRR56 pKa = 11.84VHH58 pKa = 5.46PTWRR62 pKa = 11.84MEE64 pKa = 3.91YY65 pKa = 10.61LPP67 pKa = 4.85
Molecular weight: 7.93 kDa
Isoelectric point according different methods:
Peptides (in silico digests for buttom-up proteomics)
Below you can find in silico digests of the whole proteome with Trypsin, Chymotrypsin, Trypsin+LysC, LysN, ArgC proteases suitable for different mass spec machines.| Try ESI |
 |
|---|
| ChTry ESI |
|
|---|
| ArgC ESI |
|
|---|
| LysN ESI |
|
|---|
| TryLysC ESI |
|
|---|
| Try MALDI |
|
|---|
| ChTry MALDI |
|
|---|
| ArgC MALDI |
|
|---|
| LysN MALDI |
|
|---|
| TryLysC MALDI |
|
|---|
| Try LTQ |
|
|---|
| ChTry LTQ |
|
|---|
| ArgC LTQ |
|
|---|
| LysN LTQ |
|
|---|
| TryLysC LTQ |
|
|---|
| Try MSlow |
|
|---|
| ChTry MSlow |
|
|---|
| ArgC MSlow |
|
|---|
| LysN MSlow |
|
|---|
| TryLysC MSlow |
|
|---|
| Try MShigh |
|
|---|
| ChTry MShigh |
|
|---|
| ArgC MShigh |
|
|---|
| LysN MShigh |
|
|---|
| TryLysC MShigh |
|
|---|
General Statistics
Number of major isoforms |
Number of additional isoforms |
Number of all proteins |
Number of amino acids |
Min. Seq. Length |
Max. Seq. Length |
Avg. Seq. Length |
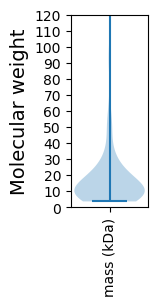
Avg. Mol. Weight |
|---|---|---|---|---|---|---|---|
0 |
17509 |
33 |
1183 |
163.6 |
17.9 |
Amino acid frequency
Ala |
Cys |
Asp |
Glu |
Phe |
Gly |
His |
Ile |
Lys |
Leu |
|---|---|---|---|---|---|---|---|---|---|
10.914 ± 0.487 | 1.314 ± 0.173 |
6.248 ± 0.226 | 6.083 ± 0.351 |
2.924 ± 0.135 | 8.653 ± 0.675 |
2.245 ± 0.154 | 4.603 ± 0.186 |
3.53 ± 0.205 | 7.71 ± 0.279 |
Met |
Asn |
Gln |
Pro |
Arg |
Ser |
Thr |
Val |
Trp |
Tyr |
|---|---|---|---|---|---|---|---|---|---|
2.193 ± 0.128 | 3.318 ± 0.187 |
5.814 ± 0.206 | 3.615 ± 0.193 |
6.808 ± 0.484 | 5.934 ± 0.372 |
6.362 ± 0.35 | 7.054 ± 0.258 |
2.279 ± 0.161 | 2.399 ± 0.109 |
Most of the basic statistics you can see at this page can be downloaded from this CSV file
See this proteome in:

Proteome-pI is available under Creative Commons Attribution-NoDerivs license, for more details see here
| Reference: Kozlowski LP. Proteome-pI 2.0: Proteome Isoelectric Point Database Update. Nucleic Acids Res. 2021, doi: 10.1093/nar/gkab944 | Contact: Lukasz P. Kozlowski |