Bacteroides sp. CAG:462
Taxonomy: cellular organisms; Bacteria; FCB group; Bacteroidetes/Chlorobi group; Bacteroidetes; Bacteroidia; Bacteroidales; Bacteroidaceae; Bacteroides; environmental samples
Average proteome isoelectric point is 6.33
Get precalculated fractions of proteins
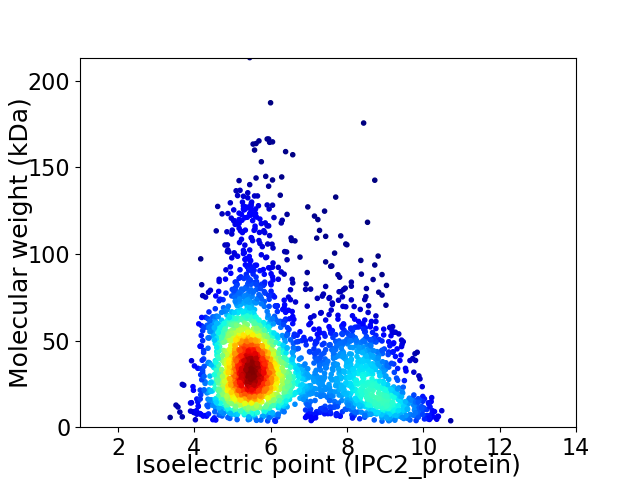
Virtual 2D-PAGE plot for 2834 proteins (isoelectric point calculated using IPC2_protein)
Get csv file with sequences according to given criteria:
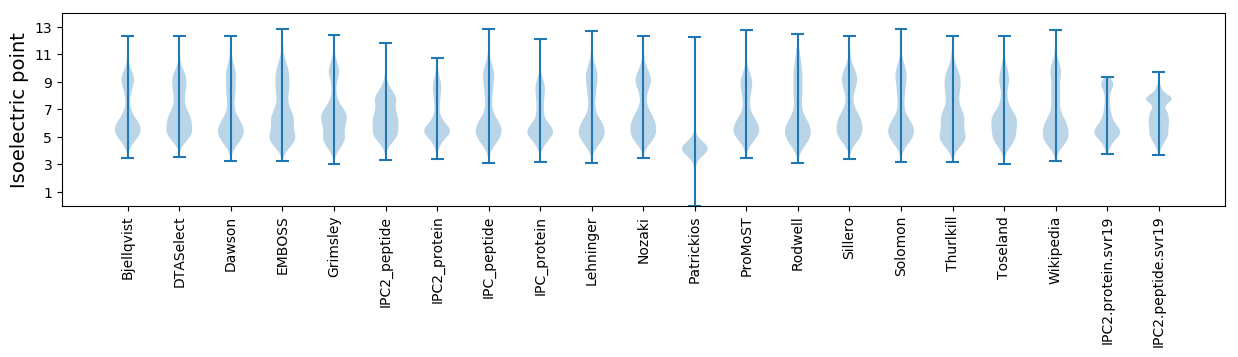
* You can choose from 21 different methods for calculating isoelectric point
Summary statistics related to proteome-wise predictions
Protein with the lowest isoelectric point:
>tr|R7CTH7|R7CTH7_9BACE Uncharacterized protein OS=Bacteroides sp. CAG:462 OX=1262740 GN=BN666_01041 PE=4 SV=1
MM1 pKa = 7.3IRR3 pKa = 11.84YY4 pKa = 7.53FIPFTLLCATLAFASCGDD22 pKa = 3.98NEE24 pKa = 5.32DD25 pKa = 3.84NDD27 pKa = 3.54IDD29 pKa = 4.1VPTEE33 pKa = 3.81EE34 pKa = 4.59VVPGTNHH41 pKa = 5.82NVLVAYY47 pKa = 9.88FSEE50 pKa = 4.42PLPDD54 pKa = 4.28GVDD57 pKa = 3.39ASTSASRR64 pKa = 11.84VIVNGDD70 pKa = 3.37LYY72 pKa = 11.59GSVEE76 pKa = 4.13YY77 pKa = 9.27MAMVISEE84 pKa = 4.17ATGADD89 pKa = 3.26VVRR92 pKa = 11.84IQTATPYY99 pKa = 10.24PGNFDD104 pKa = 4.94DD105 pKa = 6.43LASQADD111 pKa = 3.77NEE113 pKa = 4.38RR114 pKa = 11.84QNDD117 pKa = 3.37IRR119 pKa = 11.84PALATEE125 pKa = 4.39IEE127 pKa = 4.23NFDD130 pKa = 4.19DD131 pKa = 4.06YY132 pKa = 12.06DD133 pKa = 4.53VIFVGYY139 pKa = 8.16PIWWYY144 pKa = 9.73QMPMAMYY151 pKa = 10.49SFFDD155 pKa = 3.84EE156 pKa = 4.35YY157 pKa = 11.47DD158 pKa = 3.44FTGKK162 pKa = 8.06TLIPFSSHH170 pKa = 6.45GGSGWSGTVDD180 pKa = 5.13DD181 pKa = 4.73IAGMEE186 pKa = 4.32PNATMVDD193 pKa = 4.23GYY195 pKa = 10.84SISRR199 pKa = 11.84NSVEE203 pKa = 4.16GSADD207 pKa = 4.61GIRR210 pKa = 11.84EE211 pKa = 3.85WLGRR215 pKa = 11.84IGMSEE220 pKa = 3.68QQ221 pKa = 3.09
MM1 pKa = 7.3IRR3 pKa = 11.84YY4 pKa = 7.53FIPFTLLCATLAFASCGDD22 pKa = 3.98NEE24 pKa = 5.32DD25 pKa = 3.84NDD27 pKa = 3.54IDD29 pKa = 4.1VPTEE33 pKa = 3.81EE34 pKa = 4.59VVPGTNHH41 pKa = 5.82NVLVAYY47 pKa = 9.88FSEE50 pKa = 4.42PLPDD54 pKa = 4.28GVDD57 pKa = 3.39ASTSASRR64 pKa = 11.84VIVNGDD70 pKa = 3.37LYY72 pKa = 11.59GSVEE76 pKa = 4.13YY77 pKa = 9.27MAMVISEE84 pKa = 4.17ATGADD89 pKa = 3.26VVRR92 pKa = 11.84IQTATPYY99 pKa = 10.24PGNFDD104 pKa = 4.94DD105 pKa = 6.43LASQADD111 pKa = 3.77NEE113 pKa = 4.38RR114 pKa = 11.84QNDD117 pKa = 3.37IRR119 pKa = 11.84PALATEE125 pKa = 4.39IEE127 pKa = 4.23NFDD130 pKa = 4.19DD131 pKa = 4.06YY132 pKa = 12.06DD133 pKa = 4.53VIFVGYY139 pKa = 8.16PIWWYY144 pKa = 9.73QMPMAMYY151 pKa = 10.49SFFDD155 pKa = 3.84EE156 pKa = 4.35YY157 pKa = 11.47DD158 pKa = 3.44FTGKK162 pKa = 8.06TLIPFSSHH170 pKa = 6.45GGSGWSGTVDD180 pKa = 5.13DD181 pKa = 4.73IAGMEE186 pKa = 4.32PNATMVDD193 pKa = 4.23GYY195 pKa = 10.84SISRR199 pKa = 11.84NSVEE203 pKa = 4.16GSADD207 pKa = 4.61GIRR210 pKa = 11.84EE211 pKa = 3.85WLGRR215 pKa = 11.84IGMSEE220 pKa = 3.68QQ221 pKa = 3.09
Molecular weight: 24.26 kDa
Isoelectric point according different methods:
Protein with the highest isoelectric point:
>tr|R7CT45|R7CT45_9BACE Glycosyl hydrolase family 88 OS=Bacteroides sp. CAG:462 OX=1262740 GN=BN666_00886 PE=4 SV=1
MM1 pKa = 8.13RR2 pKa = 11.84IFLCRR7 pKa = 11.84HH8 pKa = 4.41AHH10 pKa = 5.76LLVTRR15 pKa = 11.84SSSPWYY21 pKa = 9.48RR22 pKa = 11.84FARR25 pKa = 11.84KK26 pKa = 9.72GSGEE30 pKa = 3.88MSISKK35 pKa = 9.04TGVTLIVTGVYY46 pKa = 9.53RR47 pKa = 11.84KK48 pKa = 9.75SYY50 pKa = 10.45RR51 pKa = 11.84GDD53 pKa = 3.41GEE55 pKa = 3.89IGLRR59 pKa = 11.84CIMQGHH65 pKa = 6.65FLLLIARR72 pKa = 11.84ASAISCMSATGNTVEE87 pKa = 4.76TDD89 pKa = 3.25NSICNSLTWKK99 pKa = 9.67PRR101 pKa = 11.84RR102 pKa = 11.84AKK104 pKa = 9.87MRR106 pKa = 11.84FIPVWAGDD114 pKa = 3.77TLSAVCLPITTLRR127 pKa = 11.84CGGSYY132 pKa = 9.17LTTEE136 pKa = 4.54RR137 pKa = 11.84MPSTFCAVRR146 pKa = 11.84MVRR149 pKa = 11.84RR150 pKa = 3.71
MM1 pKa = 8.13RR2 pKa = 11.84IFLCRR7 pKa = 11.84HH8 pKa = 4.41AHH10 pKa = 5.76LLVTRR15 pKa = 11.84SSSPWYY21 pKa = 9.48RR22 pKa = 11.84FARR25 pKa = 11.84KK26 pKa = 9.72GSGEE30 pKa = 3.88MSISKK35 pKa = 9.04TGVTLIVTGVYY46 pKa = 9.53RR47 pKa = 11.84KK48 pKa = 9.75SYY50 pKa = 10.45RR51 pKa = 11.84GDD53 pKa = 3.41GEE55 pKa = 3.89IGLRR59 pKa = 11.84CIMQGHH65 pKa = 6.65FLLLIARR72 pKa = 11.84ASAISCMSATGNTVEE87 pKa = 4.76TDD89 pKa = 3.25NSICNSLTWKK99 pKa = 9.67PRR101 pKa = 11.84RR102 pKa = 11.84AKK104 pKa = 9.87MRR106 pKa = 11.84FIPVWAGDD114 pKa = 3.77TLSAVCLPITTLRR127 pKa = 11.84CGGSYY132 pKa = 9.17LTTEE136 pKa = 4.54RR137 pKa = 11.84MPSTFCAVRR146 pKa = 11.84MVRR149 pKa = 11.84RR150 pKa = 3.71
Molecular weight: 16.74 kDa
Isoelectric point according different methods:
Peptides (in silico digests for buttom-up proteomics)
Below you can find in silico digests of the whole proteome with Trypsin, Chymotrypsin, Trypsin+LysC, LysN, ArgC proteases suitable for different mass spec machines.| Try ESI |
 |
|---|
| ChTry ESI |
|
|---|
| ArgC ESI |
|
|---|
| LysN ESI |
|
|---|
| TryLysC ESI |
|
|---|
| Try MALDI |
|
|---|
| ChTry MALDI |
|
|---|
| ArgC MALDI |
|
|---|
| LysN MALDI |
|
|---|
| TryLysC MALDI |
|
|---|
| Try LTQ |
|
|---|
| ChTry LTQ |
|
|---|
| ArgC LTQ |
|
|---|
| LysN LTQ |
|
|---|
| TryLysC LTQ |
|
|---|
| Try MSlow |
|
|---|
| ChTry MSlow |
|
|---|
| ArgC MSlow |
|
|---|
| LysN MSlow |
|
|---|
| TryLysC MSlow |
|
|---|
| Try MShigh |
|
|---|
| ChTry MShigh |
|
|---|
| ArgC MShigh |
|
|---|
| LysN MShigh |
|
|---|
| TryLysC MShigh |
|
|---|
General Statistics
Number of major isoforms |
Number of additional isoforms |
Number of all proteins |
Number of amino acids |
Min. Seq. Length |
Max. Seq. Length |
Avg. Seq. Length |
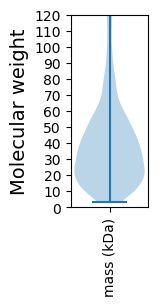
Avg. Mol. Weight |
|---|---|---|---|---|---|---|---|
0 |
1012360 |
29 |
1877 |
357.2 |
40.2 |
Amino acid frequency
Ala |
Cys |
Asp |
Glu |
Phe |
Gly |
His |
Ile |
Lys |
Leu |
|---|---|---|---|---|---|---|---|---|---|
7.776 ± 0.05 | 1.317 ± 0.018 |
5.902 ± 0.035 | 6.414 ± 0.044 |
4.324 ± 0.028 | 7.14 ± 0.042 |
2.105 ± 0.021 | 5.752 ± 0.042 |
5.325 ± 0.04 | 9.486 ± 0.049 |
Met |
Asn |
Gln |
Pro |
Arg |
Ser |
Thr |
Val |
Trp |
Tyr |
|---|---|---|---|---|---|---|---|---|---|
2.627 ± 0.018 | 4.467 ± 0.039 |
4.042 ± 0.027 | 3.46 ± 0.025 |
5.78 ± 0.04 | 5.785 ± 0.04 |
5.819 ± 0.033 | 6.835 ± 0.045 |
1.296 ± 0.02 | 4.346 ± 0.038 |
Most of the basic statistics you can see at this page can be downloaded from this CSV file
See this proteome in:

Proteome-pI is available under Creative Commons Attribution-NoDerivs license, for more details see here
| Reference: Kozlowski LP. Proteome-pI 2.0: Proteome Isoelectric Point Database Update. Nucleic Acids Res. 2021, doi: 10.1093/nar/gkab944 | Contact: Lukasz P. Kozlowski |