Yam virus X
Taxonomy: Viruses; Riboviria; Orthornavirae; Kitrinoviricota; Alsuviricetes; Tymovirales; Alphaflexiviridae; Potexvirus
Average proteome isoelectric point is 6.15
Get precalculated fractions of proteins
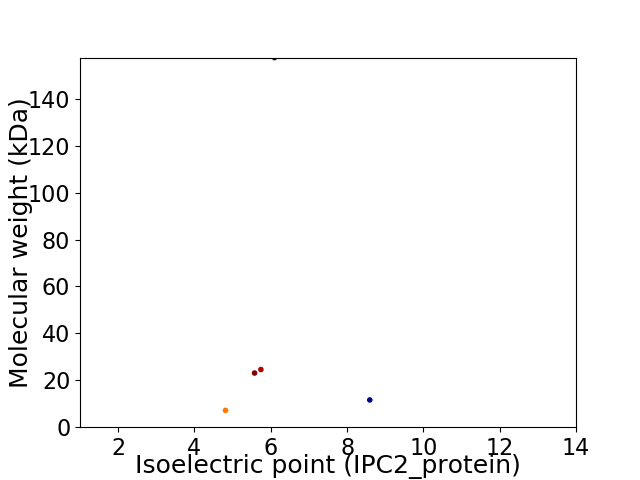
Virtual 2D-PAGE plot for 5 proteins (isoelectric point calculated using IPC2_protein)
Get csv file with sequences according to given criteria:
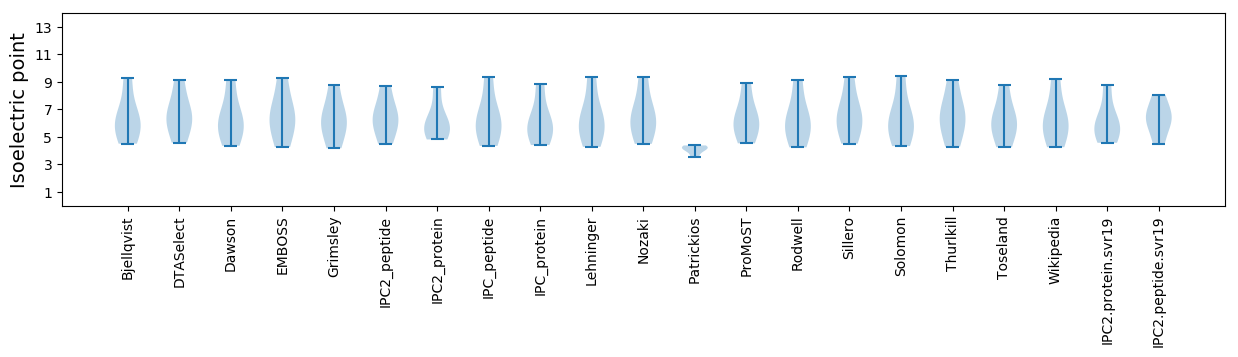
* You can choose from 21 different methods for calculating isoelectric point
Summary statistics related to proteome-wise predictions
Protein with the lowest isoelectric point:
>tr|A0A096XMC6|A0A096XMC6_9VIRU Movement protein TGBp3 OS=Yam virus X OX=1503864 GN=TGB3 PE=3 SV=1
MM1 pKa = 7.5QPLDD5 pKa = 3.63WLVALLLLLGTVFAAITIYY24 pKa = 10.62KK25 pKa = 9.41EE26 pKa = 4.31PPCTLVLDD34 pKa = 4.82GASLTITGCKK44 pKa = 8.33LTPEE48 pKa = 5.61LISQISGLSPLRR60 pKa = 11.84GLSLQEE66 pKa = 3.95FF67 pKa = 4.37
MM1 pKa = 7.5QPLDD5 pKa = 3.63WLVALLLLLGTVFAAITIYY24 pKa = 10.62KK25 pKa = 9.41EE26 pKa = 4.31PPCTLVLDD34 pKa = 4.82GASLTITGCKK44 pKa = 8.33LTPEE48 pKa = 5.61LISQISGLSPLRR60 pKa = 11.84GLSLQEE66 pKa = 3.95FF67 pKa = 4.37
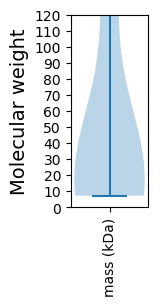
Molecular weight: 7.18 kDa
Isoelectric point according different methods:
Protein with the highest isoelectric point:
>tr|A0A096XLM0|A0A096XLM0_9VIRU Triple gene block 1 OS=Yam virus X OX=1503864 GN=TGB1 PE=4 SV=1
MM1 pKa = 7.95PLTPPPDD8 pKa = 3.36HH9 pKa = 6.38STTFRR14 pKa = 11.84IAAATVGLALIFFTLTRR31 pKa = 11.84STLPHH36 pKa = 6.48VGDD39 pKa = 4.85NIHH42 pKa = 6.59HH43 pKa = 6.84LPHH46 pKa = 6.61GGCYY50 pKa = 9.29RR51 pKa = 11.84DD52 pKa = 3.46GTKK55 pKa = 9.77TIKK58 pKa = 10.76YY59 pKa = 8.97NSPSANANNTPAWALPAVLILSALIYY85 pKa = 8.85ATSRR89 pKa = 11.84LASCSVTSTRR99 pKa = 11.84YY100 pKa = 9.91CIRR103 pKa = 11.84SDD105 pKa = 3.49NNLL108 pKa = 3.22
MM1 pKa = 7.95PLTPPPDD8 pKa = 3.36HH9 pKa = 6.38STTFRR14 pKa = 11.84IAAATVGLALIFFTLTRR31 pKa = 11.84STLPHH36 pKa = 6.48VGDD39 pKa = 4.85NIHH42 pKa = 6.59HH43 pKa = 6.84LPHH46 pKa = 6.61GGCYY50 pKa = 9.29RR51 pKa = 11.84DD52 pKa = 3.46GTKK55 pKa = 9.77TIKK58 pKa = 10.76YY59 pKa = 8.97NSPSANANNTPAWALPAVLILSALIYY85 pKa = 8.85ATSRR89 pKa = 11.84LASCSVTSTRR99 pKa = 11.84YY100 pKa = 9.91CIRR103 pKa = 11.84SDD105 pKa = 3.49NNLL108 pKa = 3.22
Molecular weight: 11.62 kDa
Isoelectric point according different methods:
Peptides (in silico digests for buttom-up proteomics)
Below you can find in silico digests of the whole proteome with Trypsin, Chymotrypsin, Trypsin+LysC, LysN, ArgC proteases suitable for different mass spec machines.| Try ESI |
 |
|---|
| ChTry ESI |
|
|---|
| ArgC ESI |
|
|---|
| LysN ESI |
|
|---|
| TryLysC ESI |
|
|---|
| Try MALDI |
|
|---|
| ChTry MALDI |
|
|---|
| ArgC MALDI |
|
|---|
| LysN MALDI |
|
|---|
| TryLysC MALDI |
|
|---|
| Try LTQ |
|
|---|
| ChTry LTQ |
|
|---|
| ArgC LTQ |
|
|---|
| LysN LTQ |
|
|---|
| TryLysC LTQ |
|
|---|
| Try MSlow |
|
|---|
| ChTry MSlow |
|
|---|
| ArgC MSlow |
|
|---|
| LysN MSlow |
|
|---|
| TryLysC MSlow |
|
|---|
| Try MShigh |
|
|---|
| ChTry MShigh |
|
|---|
| ArgC MShigh |
|
|---|
| LysN MShigh |
|
|---|
| TryLysC MShigh |
|
|---|
General Statistics
Number of major isoforms |
Number of additional isoforms |
Number of all proteins |
Number of amino acids |
Min. Seq. Length |
Max. Seq. Length |
Avg. Seq. Length |
Avg. Mol. Weight |
|---|---|---|---|---|---|---|---|
0 |
1997 |
67 |
1386 |
399.4 |
44.82 |
Amino acid frequency
Ala |
Cys |
Asp |
Glu |
Phe |
Gly |
His |
Ile |
Lys |
Leu |
|---|---|---|---|---|---|---|---|---|---|
8.112 ± 1.376 | 1.953 ± 0.246 |
5.058 ± 0.451 | 5.859 ± 1.286 |
5.508 ± 0.724 | 4.407 ± 0.671 |
2.554 ± 0.503 | 6.209 ± 0.232 |
5.809 ± 1.399 | 10.516 ± 1.745 |
Met |
Asn |
Gln |
Pro |
Arg |
Ser |
Thr |
Val |
Trp |
Tyr |
|---|---|---|---|---|---|---|---|---|---|
1.953 ± 0.476 | 5.258 ± 0.632 |
5.158 ± 0.754 | 3.906 ± 0.588 |
4.457 ± 0.367 | 7.011 ± 0.546 |
7.461 ± 1.131 | 5.108 ± 0.711 |
1.002 ± 0.183 | 2.704 ± 0.426 |
Most of the basic statistics you can see at this page can be downloaded from this CSV file
See this proteome in:

Proteome-pI is available under Creative Commons Attribution-NoDerivs license, for more details see here
| Reference: Kozlowski LP. Proteome-pI 2.0: Proteome Isoelectric Point Database Update. Nucleic Acids Res. 2021, doi: 10.1093/nar/gkab944 | Contact: Lukasz P. Kozlowski |