Roseivivax pacificus
Taxonomy: cellular organisms; Bacteria; Proteobacteria; Alphaproteobacteria; Rhodobacterales; Rhodobacteraceae; Allosediminivita
Average proteome isoelectric point is 6.03
Get precalculated fractions of proteins
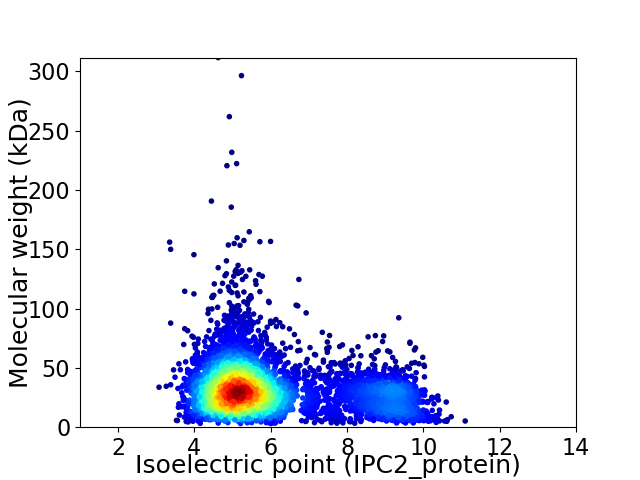
Virtual 2D-PAGE plot for 4615 proteins (isoelectric point calculated using IPC2_protein)
Get csv file with sequences according to given criteria:
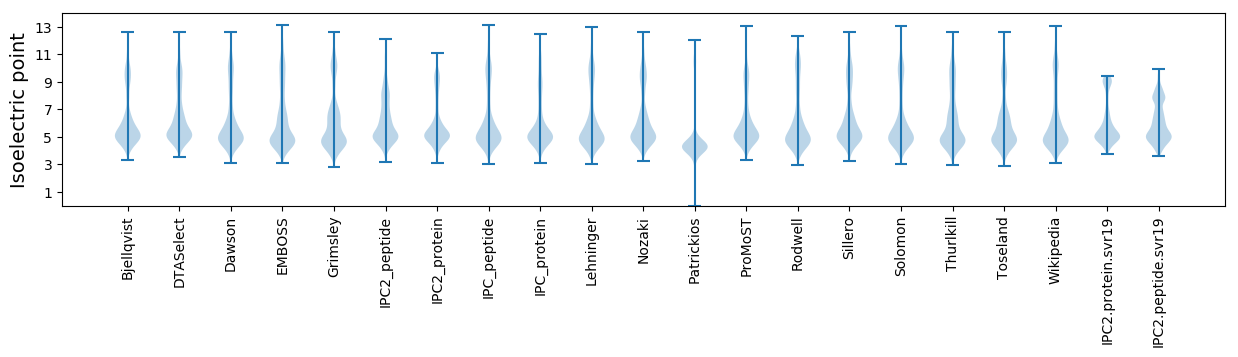
* You can choose from 21 different methods for calculating isoelectric point
Summary statistics related to proteome-wise predictions
Protein with the lowest isoelectric point:
>tr|A0A2T5ZWM0|A0A2T5ZWM0_9RHOB Type IV secretion system protein VirB3 OS=Roseivivax pacificus OX=1267769 GN=C8N44_1637 PE=4 SV=1
QQ1 pKa = 7.63PDD3 pKa = 3.43ADD5 pKa = 3.71AQQTVDD11 pKa = 4.54AFSEE15 pKa = 4.51AYY17 pKa = 9.88PNVEE21 pKa = 4.09VEE23 pKa = 4.23WVRR26 pKa = 11.84DD27 pKa = 3.46GTTQMMARR35 pKa = 11.84LRR37 pKa = 11.84AEE39 pKa = 4.42FEE41 pKa = 4.19AGQPQPDD48 pKa = 3.71VLLIADD54 pKa = 4.56TVTMEE59 pKa = 4.35SLEE62 pKa = 4.11QEE64 pKa = 4.58GRR66 pKa = 11.84LLAYY70 pKa = 9.92PEE72 pKa = 5.08ADD74 pKa = 2.82TAAYY78 pKa = 9.99QEE80 pKa = 4.49ALMDD84 pKa = 3.84PEE86 pKa = 5.43GYY88 pKa = 10.5YY89 pKa = 10.8FSTKK93 pKa = 10.38LITSGIVYY101 pKa = 8.06NTAAEE106 pKa = 4.26MVPSSYY112 pKa = 11.18EE113 pKa = 3.71DD114 pKa = 3.67LLAEE118 pKa = 4.13EE119 pKa = 4.41ATNNIVMPSPLEE131 pKa = 4.14SGAATIHH138 pKa = 5.55MVSLTGLPEE147 pKa = 4.68LGWNYY152 pKa = 10.39YY153 pKa = 10.01QGLADD158 pKa = 4.07QGAIAQGGNGGTYY171 pKa = 9.68RR172 pKa = 11.84AVAGGQALYY181 pKa = 10.97GFVVDD186 pKa = 7.14FLALRR191 pKa = 11.84NIQDD195 pKa = 3.68GAPVGFVFPEE205 pKa = 4.09EE206 pKa = 4.17GVSAVTEE213 pKa = 3.94PVAILEE219 pKa = 4.42SANNVPAAKK228 pKa = 10.3AFVDD232 pKa = 4.7FVISEE237 pKa = 4.22EE238 pKa = 4.23GQEE241 pKa = 3.75LAARR245 pKa = 11.84QGYY248 pKa = 9.37LPAHH252 pKa = 7.28PDD254 pKa = 3.08VAAPDD259 pKa = 3.91YY260 pKa = 10.94FPDD263 pKa = 3.58RR264 pKa = 11.84SEE266 pKa = 3.95ISVITFDD273 pKa = 4.29PAEE276 pKa = 4.13ALEE279 pKa = 4.34NDD281 pKa = 3.4AAYY284 pKa = 9.81KK285 pKa = 10.46EE286 pKa = 4.62RR287 pKa = 11.84FSEE290 pKa = 4.25MFGGG294 pKa = 3.99
QQ1 pKa = 7.63PDD3 pKa = 3.43ADD5 pKa = 3.71AQQTVDD11 pKa = 4.54AFSEE15 pKa = 4.51AYY17 pKa = 9.88PNVEE21 pKa = 4.09VEE23 pKa = 4.23WVRR26 pKa = 11.84DD27 pKa = 3.46GTTQMMARR35 pKa = 11.84LRR37 pKa = 11.84AEE39 pKa = 4.42FEE41 pKa = 4.19AGQPQPDD48 pKa = 3.71VLLIADD54 pKa = 4.56TVTMEE59 pKa = 4.35SLEE62 pKa = 4.11QEE64 pKa = 4.58GRR66 pKa = 11.84LLAYY70 pKa = 9.92PEE72 pKa = 5.08ADD74 pKa = 2.82TAAYY78 pKa = 9.99QEE80 pKa = 4.49ALMDD84 pKa = 3.84PEE86 pKa = 5.43GYY88 pKa = 10.5YY89 pKa = 10.8FSTKK93 pKa = 10.38LITSGIVYY101 pKa = 8.06NTAAEE106 pKa = 4.26MVPSSYY112 pKa = 11.18EE113 pKa = 3.71DD114 pKa = 3.67LLAEE118 pKa = 4.13EE119 pKa = 4.41ATNNIVMPSPLEE131 pKa = 4.14SGAATIHH138 pKa = 5.55MVSLTGLPEE147 pKa = 4.68LGWNYY152 pKa = 10.39YY153 pKa = 10.01QGLADD158 pKa = 4.07QGAIAQGGNGGTYY171 pKa = 9.68RR172 pKa = 11.84AVAGGQALYY181 pKa = 10.97GFVVDD186 pKa = 7.14FLALRR191 pKa = 11.84NIQDD195 pKa = 3.68GAPVGFVFPEE205 pKa = 4.09EE206 pKa = 4.17GVSAVTEE213 pKa = 3.94PVAILEE219 pKa = 4.42SANNVPAAKK228 pKa = 10.3AFVDD232 pKa = 4.7FVISEE237 pKa = 4.22EE238 pKa = 4.23GQEE241 pKa = 3.75LAARR245 pKa = 11.84QGYY248 pKa = 9.37LPAHH252 pKa = 7.28PDD254 pKa = 3.08VAAPDD259 pKa = 3.91YY260 pKa = 10.94FPDD263 pKa = 3.58RR264 pKa = 11.84SEE266 pKa = 3.95ISVITFDD273 pKa = 4.29PAEE276 pKa = 4.13ALEE279 pKa = 4.34NDD281 pKa = 3.4AAYY284 pKa = 9.81KK285 pKa = 10.46EE286 pKa = 4.62RR287 pKa = 11.84FSEE290 pKa = 4.25MFGGG294 pKa = 3.99
Molecular weight: 31.62 kDa
Isoelectric point according different methods:
Protein with the highest isoelectric point:
>tr|A0A2T6AX61|A0A2T6AX61_9RHOB Threonine/homoserine/homoserine lactone efflux protein OS=Roseivivax pacificus OX=1267769 GN=C8N44_109105 PE=4 SV=1
MM1 pKa = 7.45KK2 pKa = 9.61RR3 pKa = 11.84TFQPSNYY10 pKa = 8.43VRR12 pKa = 11.84KK13 pKa = 9.11HH14 pKa = 3.78RR15 pKa = 11.84HH16 pKa = 4.09GFRR19 pKa = 11.84SRR21 pKa = 11.84MATKK25 pKa = 10.45AGRR28 pKa = 11.84KK29 pKa = 8.54ILNARR34 pKa = 11.84RR35 pKa = 11.84ARR37 pKa = 11.84GRR39 pKa = 11.84KK40 pKa = 9.02KK41 pKa = 10.61LSAA44 pKa = 4.03
MM1 pKa = 7.45KK2 pKa = 9.61RR3 pKa = 11.84TFQPSNYY10 pKa = 8.43VRR12 pKa = 11.84KK13 pKa = 9.11HH14 pKa = 3.78RR15 pKa = 11.84HH16 pKa = 4.09GFRR19 pKa = 11.84SRR21 pKa = 11.84MATKK25 pKa = 10.45AGRR28 pKa = 11.84KK29 pKa = 8.54ILNARR34 pKa = 11.84RR35 pKa = 11.84ARR37 pKa = 11.84GRR39 pKa = 11.84KK40 pKa = 9.02KK41 pKa = 10.61LSAA44 pKa = 4.03
Molecular weight: 5.23 kDa
Isoelectric point according different methods:
Peptides (in silico digests for buttom-up proteomics)
Below you can find in silico digests of the whole proteome with Trypsin, Chymotrypsin, Trypsin+LysC, LysN, ArgC proteases suitable for different mass spec machines.| Try ESI |
 |
|---|
| ChTry ESI |
|
|---|
| ArgC ESI |
|
|---|
| LysN ESI |
|
|---|
| TryLysC ESI |
|
|---|
| Try MALDI |
|
|---|
| ChTry MALDI |
|
|---|
| ArgC MALDI |
|
|---|
| LysN MALDI |
|
|---|
| TryLysC MALDI |
|
|---|
| Try LTQ |
|
|---|
| ChTry LTQ |
|
|---|
| ArgC LTQ |
|
|---|
| LysN LTQ |
|
|---|
| TryLysC LTQ |
|
|---|
| Try MSlow |
|
|---|
| ChTry MSlow |
|
|---|
| ArgC MSlow |
|
|---|
| LysN MSlow |
|
|---|
| TryLysC MSlow |
|
|---|
| Try MShigh |
|
|---|
| ChTry MShigh |
|
|---|
| ArgC MShigh |
|
|---|
| LysN MShigh |
|
|---|
| TryLysC MShigh |
|
|---|
General Statistics
Number of major isoforms |
Number of additional isoforms |
Number of all proteins |
Number of amino acids |
Min. Seq. Length |
Max. Seq. Length |
Avg. Seq. Length |
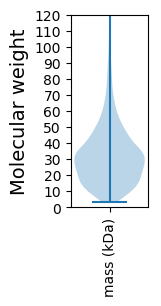
Avg. Mol. Weight |
|---|---|---|---|---|---|---|---|
0 |
1438208 |
26 |
2928 |
311.6 |
33.8 |
Amino acid frequency
Ala |
Cys |
Asp |
Glu |
Phe |
Gly |
His |
Ile |
Lys |
Leu |
|---|---|---|---|---|---|---|---|---|---|
12.412 ± 0.053 | 0.862 ± 0.012 |
6.014 ± 0.031 | 6.447 ± 0.038 |
3.607 ± 0.022 | 8.937 ± 0.035 |
2.033 ± 0.015 | 4.791 ± 0.024 |
2.613 ± 0.032 | 10.196 ± 0.048 |
Met |
Asn |
Gln |
Pro |
Arg |
Ser |
Thr |
Val |
Trp |
Tyr |
|---|---|---|---|---|---|---|---|---|---|
2.749 ± 0.02 | 2.281 ± 0.02 |
5.312 ± 0.027 | 3.047 ± 0.022 |
7.187 ± 0.039 | 5.158 ± 0.023 |
5.458 ± 0.024 | 7.318 ± 0.03 |
1.427 ± 0.015 | 2.151 ± 0.019 |
Most of the basic statistics you can see at this page can be downloaded from this CSV file
See this proteome in:

Proteome-pI is available under Creative Commons Attribution-NoDerivs license, for more details see here
| Reference: Kozlowski LP. Proteome-pI 2.0: Proteome Isoelectric Point Database Update. Nucleic Acids Res. 2021, doi: 10.1093/nar/gkab944 | Contact: Lukasz P. Kozlowski |