Enterobacter phage vB_EclM_CIP9
Taxonomy: Viruses; Duplodnaviria; Heunggongvirae; Uroviricota; Caudoviricetes; Caudovirales; Myoviridae; Kanagawavirus; Enterobacter virus CIP9
Average proteome isoelectric point is 6.13
Get precalculated fractions of proteins
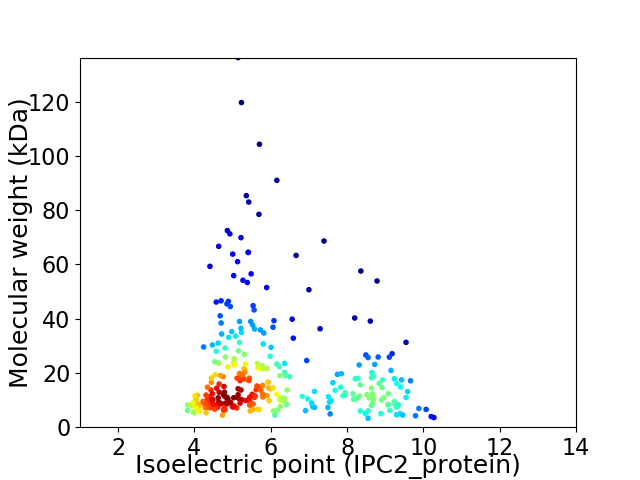
Virtual 2D-PAGE plot for 296 proteins (isoelectric point calculated using IPC2_protein)
Get csv file with sequences according to given criteria:
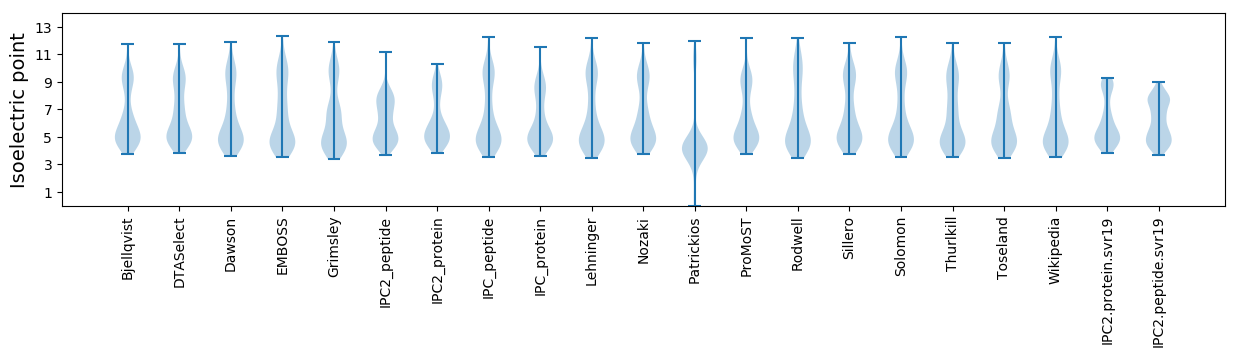
* You can choose from 21 different methods for calculating isoelectric point
Summary statistics related to proteome-wise predictions
Protein with the lowest isoelectric point:
>tr|A0A6B9XXP7|A0A6B9XXP7_9CAUD Nudix hydrolase OS=Enterobacter phage vB_EclM_CIP9 OX=2696340 GN=nudE PE=4 SV=1
MM1 pKa = 7.34EE2 pKa = 5.33VILFAVAYY10 pKa = 8.48VIVGFASAFYY20 pKa = 9.86FRR22 pKa = 11.84WVGDD26 pKa = 3.34WFLDD30 pKa = 4.16DD31 pKa = 5.11FDD33 pKa = 6.57GNTAAMVVVMWPVFWIFYY51 pKa = 8.55ILKK54 pKa = 9.76VLISPFVWICEE65 pKa = 4.3MIFDD69 pKa = 4.49
MM1 pKa = 7.34EE2 pKa = 5.33VILFAVAYY10 pKa = 8.48VIVGFASAFYY20 pKa = 9.86FRR22 pKa = 11.84WVGDD26 pKa = 3.34WFLDD30 pKa = 4.16DD31 pKa = 5.11FDD33 pKa = 6.57GNTAAMVVVMWPVFWIFYY51 pKa = 8.55ILKK54 pKa = 9.76VLISPFVWICEE65 pKa = 4.3MIFDD69 pKa = 4.49
Molecular weight: 8.17 kDa
Isoelectric point according different methods:
Protein with the highest isoelectric point:
>tr|A0A6B9XYE1|A0A6B9XYE1_9CAUD DNA endonuclease IV OS=Enterobacter phage vB_EclM_CIP9 OX=2696340 GN=denB PE=4 SV=1
MM1 pKa = 7.9PCRR4 pKa = 11.84KK5 pKa = 9.71VGLINKK11 pKa = 8.96RR12 pKa = 11.84PKK14 pKa = 10.01PSEE17 pKa = 3.26EE18 pKa = 3.76RR19 pKa = 11.84MRR21 pKa = 11.84KK22 pKa = 8.11FQEE25 pKa = 4.58FINAALKK32 pKa = 10.56RR33 pKa = 11.84NKK35 pKa = 10.08
MM1 pKa = 7.9PCRR4 pKa = 11.84KK5 pKa = 9.71VGLINKK11 pKa = 8.96RR12 pKa = 11.84PKK14 pKa = 10.01PSEE17 pKa = 3.26EE18 pKa = 3.76RR19 pKa = 11.84MRR21 pKa = 11.84KK22 pKa = 8.11FQEE25 pKa = 4.58FINAALKK32 pKa = 10.56RR33 pKa = 11.84NKK35 pKa = 10.08
Molecular weight: 4.22 kDa
Isoelectric point according different methods:
Peptides (in silico digests for buttom-up proteomics)
Below you can find in silico digests of the whole proteome with Trypsin, Chymotrypsin, Trypsin+LysC, LysN, ArgC proteases suitable for different mass spec machines.| Try ESI |
 |
|---|
| ChTry ESI |
|
|---|
| ArgC ESI |
|
|---|
| LysN ESI |
|
|---|
| TryLysC ESI |
|
|---|
| Try MALDI |
|
|---|
| ChTry MALDI |
|
|---|
| ArgC MALDI |
|
|---|
| LysN MALDI |
|
|---|
| TryLysC MALDI |
|
|---|
| Try LTQ |
|
|---|
| ChTry LTQ |
|
|---|
| ArgC LTQ |
|
|---|
| LysN LTQ |
|
|---|
| TryLysC LTQ |
|
|---|
| Try MSlow |
|
|---|
| ChTry MSlow |
|
|---|
| ArgC MSlow |
|
|---|
| LysN MSlow |
|
|---|
| TryLysC MSlow |
|
|---|
| Try MShigh |
|
|---|
| ChTry MShigh |
|
|---|
| ArgC MShigh |
|
|---|
| LysN MShigh |
|
|---|
| TryLysC MShigh |
|
|---|
General Statistics
Number of major isoforms |
Number of additional isoforms |
Number of all proteins |
Number of amino acids |
Min. Seq. Length |
Max. Seq. Length |
Avg. Seq. Length |
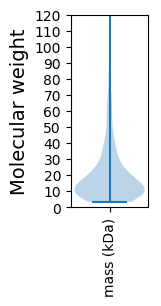
Avg. Mol. Weight |
|---|---|---|---|---|---|---|---|
0 |
54571 |
31 |
1247 |
184.4 |
20.89 |
Amino acid frequency
Ala |
Cys |
Asp |
Glu |
Phe |
Gly |
His |
Ile |
Lys |
Leu |
|---|---|---|---|---|---|---|---|---|---|
7.266 ± 0.186 | 1.09 ± 0.068 |
6.399 ± 0.108 | 7.222 ± 0.158 |
4.468 ± 0.122 | 6.357 ± 0.174 |
1.818 ± 0.081 | 6.613 ± 0.113 |
7.268 ± 0.202 | 7.528 ± 0.153 |
Met |
Asn |
Gln |
Pro |
Arg |
Ser |
Thr |
Val |
Trp |
Tyr |
|---|---|---|---|---|---|---|---|---|---|
2.994 ± 0.085 | 5.204 ± 0.109 |
3.698 ± 0.095 | 3.59 ± 0.085 |
4.568 ± 0.103 | 5.917 ± 0.128 |
5.628 ± 0.172 | 6.82 ± 0.123 |
1.471 ± 0.063 | 4.081 ± 0.12 |
Most of the basic statistics you can see at this page can be downloaded from this CSV file
See this proteome in:

Proteome-pI is available under Creative Commons Attribution-NoDerivs license, for more details see here
| Reference: Kozlowski LP. Proteome-pI 2.0: Proteome Isoelectric Point Database Update. Nucleic Acids Res. 2021, doi: 10.1093/nar/gkab944 | Contact: Lukasz P. Kozlowski |