Firmicutes bacterium CAG:884
Taxonomy: cellular organisms; Bacteria; Terrabacteria group; Firmicutes; environmental samples
Average proteome isoelectric point is 6.78
Get precalculated fractions of proteins
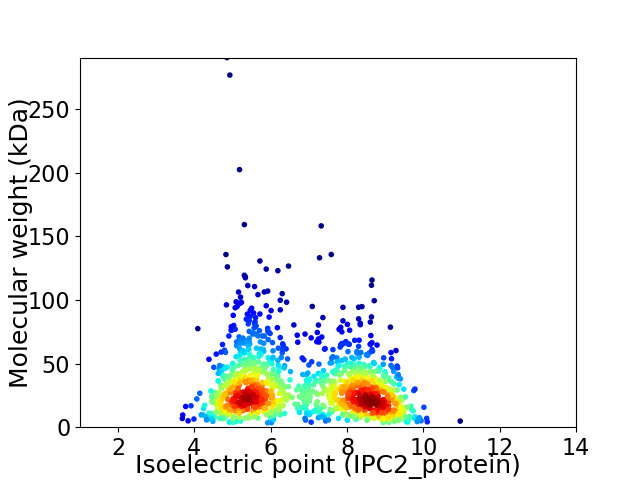
Virtual 2D-PAGE plot for 1232 proteins (isoelectric point calculated using IPC2_protein)
Get csv file with sequences according to given criteria:
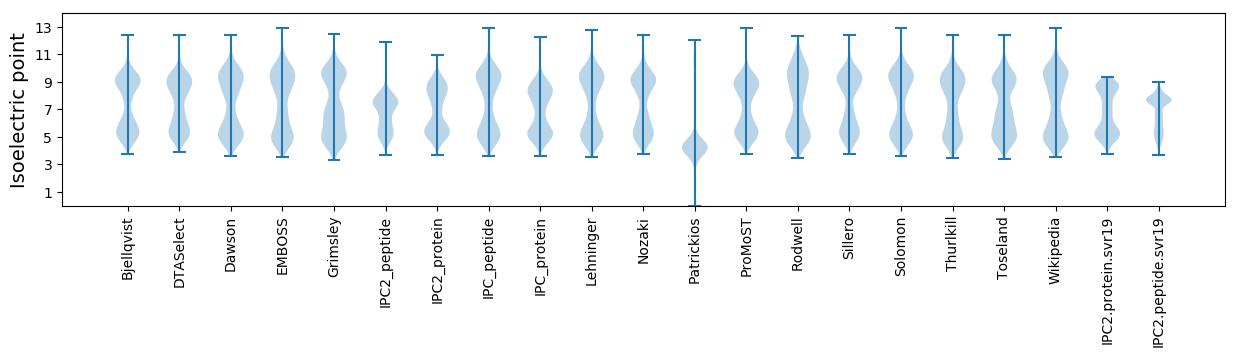
* You can choose from 21 different methods for calculating isoelectric point
Summary statistics related to proteome-wise predictions
Protein with the lowest isoelectric point:
>tr|R5MRR5|R5MRR5_9FIRM NERD domain-containing protein OS=Firmicutes bacterium CAG:884 OX=1262990 GN=BN804_00599 PE=4 SV=1
MM1 pKa = 7.69KK2 pKa = 8.81MTVDD6 pKa = 3.4KK7 pKa = 10.51NACIGCGACVGTCDD21 pKa = 4.64KK22 pKa = 11.38VFGFEE27 pKa = 4.14DD28 pKa = 3.54NYY30 pKa = 11.7AEE32 pKa = 4.46VIVDD36 pKa = 5.31EE37 pKa = 4.63IPEE40 pKa = 4.23DD41 pKa = 3.81LKK43 pKa = 11.32EE44 pKa = 4.23DD45 pKa = 3.98AMDD48 pKa = 4.27ALEE51 pKa = 4.72GCPVDD56 pKa = 4.96AISIVDD62 pKa = 3.49EE63 pKa = 4.45SS64 pKa = 3.67
MM1 pKa = 7.69KK2 pKa = 8.81MTVDD6 pKa = 3.4KK7 pKa = 10.51NACIGCGACVGTCDD21 pKa = 4.64KK22 pKa = 11.38VFGFEE27 pKa = 4.14DD28 pKa = 3.54NYY30 pKa = 11.7AEE32 pKa = 4.46VIVDD36 pKa = 5.31EE37 pKa = 4.63IPEE40 pKa = 4.23DD41 pKa = 3.81LKK43 pKa = 11.32EE44 pKa = 4.23DD45 pKa = 3.98AMDD48 pKa = 4.27ALEE51 pKa = 4.72GCPVDD56 pKa = 4.96AISIVDD62 pKa = 3.49EE63 pKa = 4.45SS64 pKa = 3.67
Molecular weight: 6.83 kDa
Isoelectric point according different methods:
Protein with the highest isoelectric point:
>tr|R5MPF3|R5MPF3_9FIRM Uncharacterized protein OS=Firmicutes bacterium CAG:884 OX=1262990 GN=BN804_00182 PE=4 SV=1
MM1 pKa = 7.58KK2 pKa = 9.45GTYY5 pKa = 9.03QPNNRR10 pKa = 11.84KK11 pKa = 9.36RR12 pKa = 11.84SKK14 pKa = 10.57KK15 pKa = 9.71QGFLARR21 pKa = 11.84MKK23 pKa = 10.42TNVINKK29 pKa = 8.92RR30 pKa = 11.84RR31 pKa = 11.84RR32 pKa = 11.84KK33 pKa = 8.28GRR35 pKa = 11.84KK36 pKa = 8.67VLAHH40 pKa = 6.78
MM1 pKa = 7.58KK2 pKa = 9.45GTYY5 pKa = 9.03QPNNRR10 pKa = 11.84KK11 pKa = 9.36RR12 pKa = 11.84SKK14 pKa = 10.57KK15 pKa = 9.71QGFLARR21 pKa = 11.84MKK23 pKa = 10.42TNVINKK29 pKa = 8.92RR30 pKa = 11.84RR31 pKa = 11.84RR32 pKa = 11.84KK33 pKa = 8.28GRR35 pKa = 11.84KK36 pKa = 8.67VLAHH40 pKa = 6.78
Molecular weight: 4.8 kDa
Isoelectric point according different methods:
Peptides (in silico digests for buttom-up proteomics)
Below you can find in silico digests of the whole proteome with Trypsin, Chymotrypsin, Trypsin+LysC, LysN, ArgC proteases suitable for different mass spec machines.| Try ESI |
 |
|---|
| ChTry ESI |
|
|---|
| ArgC ESI |
|
|---|
| LysN ESI |
|
|---|
| TryLysC ESI |
|
|---|
| Try MALDI |
|
|---|
| ChTry MALDI |
|
|---|
| ArgC MALDI |
|
|---|
| LysN MALDI |
|
|---|
| TryLysC MALDI |
|
|---|
| Try LTQ |
|
|---|
| ChTry LTQ |
|
|---|
| ArgC LTQ |
|
|---|
| LysN LTQ |
|
|---|
| TryLysC LTQ |
|
|---|
| Try MSlow |
|
|---|
| ChTry MSlow |
|
|---|
| ArgC MSlow |
|
|---|
| LysN MSlow |
|
|---|
| TryLysC MSlow |
|
|---|
| Try MShigh |
|
|---|
| ChTry MShigh |
|
|---|
| ArgC MShigh |
|
|---|
| LysN MShigh |
|
|---|
| TryLysC MShigh |
|
|---|
General Statistics
Number of major isoforms |
Number of additional isoforms |
Number of all proteins |
Number of amino acids |
Min. Seq. Length |
Max. Seq. Length |
Avg. Seq. Length |
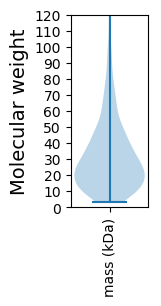
Avg. Mol. Weight |
|---|---|---|---|---|---|---|---|
0 |
363460 |
29 |
2672 |
295.0 |
33.83 |
Amino acid frequency
Ala |
Cys |
Asp |
Glu |
Phe |
Gly |
His |
Ile |
Lys |
Leu |
|---|---|---|---|---|---|---|---|---|---|
4.229 ± 0.063 | 1.153 ± 0.03 |
5.887 ± 0.063 | 7.318 ± 0.084 |
4.272 ± 0.048 | 5.356 ± 0.091 |
1.199 ± 0.029 | 10.28 ± 0.094 |
10.19 ± 0.087 | 9.007 ± 0.078 |
Met |
Asn |
Gln |
Pro |
Arg |
Ser |
Thr |
Val |
Trp |
Tyr |
|---|---|---|---|---|---|---|---|---|---|
2.398 ± 0.034 | 7.944 ± 0.085 |
2.425 ± 0.033 | 1.841 ± 0.031 |
3.105 ± 0.049 | 6.126 ± 0.081 |
5.245 ± 0.079 | 5.997 ± 0.06 |
0.534 ± 0.017 | 5.491 ± 0.068 |
Most of the basic statistics you can see at this page can be downloaded from this CSV file
See this proteome in:

Proteome-pI is available under Creative Commons Attribution-NoDerivs license, for more details see here
| Reference: Kozlowski LP. Proteome-pI 2.0: Proteome Isoelectric Point Database Update. Nucleic Acids Res. 2021, doi: 10.1093/nar/gkab944 | Contact: Lukasz P. Kozlowski |