Lachnospiraceae bacterium TWA4
Taxonomy: cellular organisms; Bacteria; Terrabacteria group; Firmicutes; Clostridia; Eubacteriales; Lachnospiraceae; unclassified Lachnospiraceae
Average proteome isoelectric point is 6.15
Get precalculated fractions of proteins
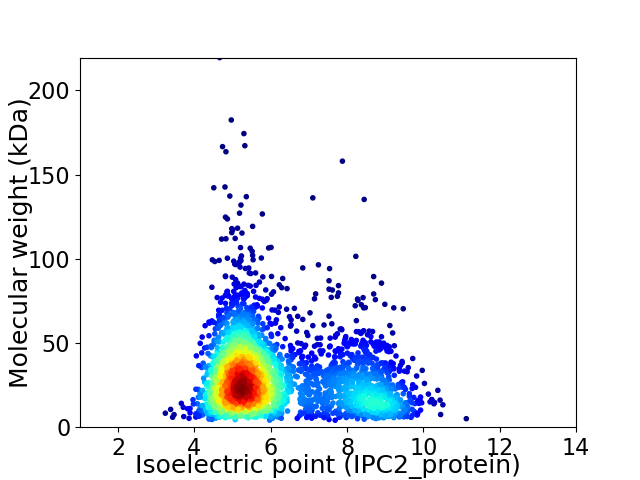
Virtual 2D-PAGE plot for 2918 proteins (isoelectric point calculated using IPC2_protein)
Get csv file with sequences according to given criteria:
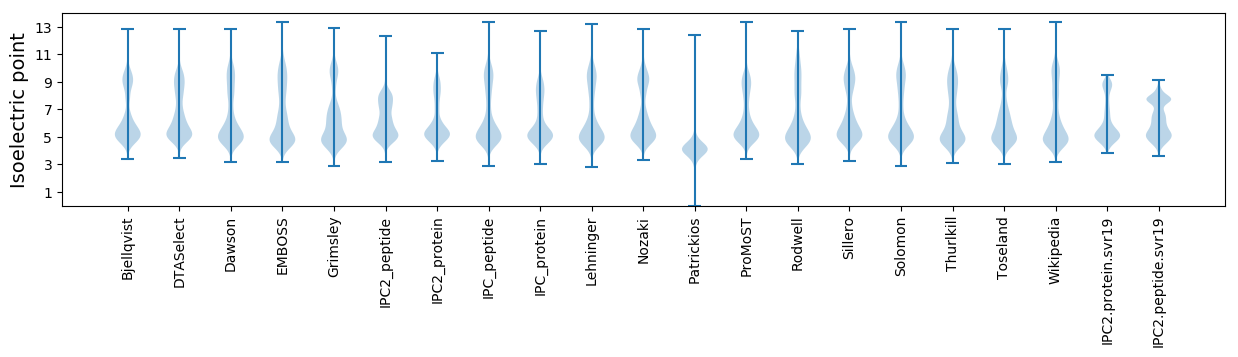
* You can choose from 21 different methods for calculating isoelectric point
Summary statistics related to proteome-wise predictions
Protein with the lowest isoelectric point:
>tr|A0A0D0QS32|A0A0D0QS32_9FIRM TWA4_scaffold00001 whole genome shotgun sequence OS=Lachnospiraceae bacterium TWA4 OX=1392836 GN=P261_02618 PE=4 SV=1
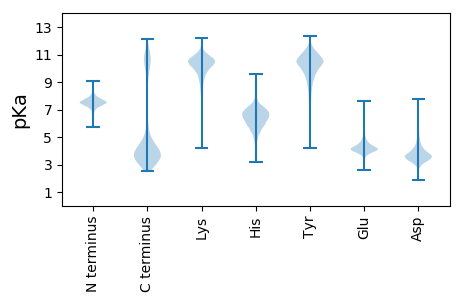
MM1 pKa = 7.44KK2 pKa = 10.2AYY4 pKa = 10.3VDD6 pKa = 3.44QDD8 pKa = 3.15ICIGCGLCAGMEE20 pKa = 4.15PNIFRR25 pKa = 11.84MNNEE29 pKa = 3.43GKK31 pKa = 10.39AEE33 pKa = 4.04TFAEE37 pKa = 4.47GDD39 pKa = 3.74DD40 pKa = 4.27EE41 pKa = 4.67NVQDD45 pKa = 5.41VIDD48 pKa = 4.18SCPVEE53 pKa = 5.0AISEE57 pKa = 4.25EE58 pKa = 4.23
MM1 pKa = 7.44KK2 pKa = 10.2AYY4 pKa = 10.3VDD6 pKa = 3.44QDD8 pKa = 3.15ICIGCGLCAGMEE20 pKa = 4.15PNIFRR25 pKa = 11.84MNNEE29 pKa = 3.43GKK31 pKa = 10.39AEE33 pKa = 4.04TFAEE37 pKa = 4.47GDD39 pKa = 3.74DD40 pKa = 4.27EE41 pKa = 4.67NVQDD45 pKa = 5.41VIDD48 pKa = 4.18SCPVEE53 pKa = 5.0AISEE57 pKa = 4.25EE58 pKa = 4.23
Molecular weight: 6.32 kDa
Isoelectric point according different methods:
Protein with the highest isoelectric point:
>tr|A0A0D0QNM5|A0A0D0QNM5_9FIRM TWA4_scaffold00001 whole genome shotgun sequence OS=Lachnospiraceae bacterium TWA4 OX=1392836 GN=P261_01403 PE=4 SV=1
MM1 pKa = 7.67KK2 pKa = 8.72MTFQPKK8 pKa = 8.95KK9 pKa = 7.58RR10 pKa = 11.84QRR12 pKa = 11.84SKK14 pKa = 9.17VHH16 pKa = 5.89GFRR19 pKa = 11.84ARR21 pKa = 11.84MSSAGGRR28 pKa = 11.84KK29 pKa = 8.76VLQARR34 pKa = 11.84RR35 pKa = 11.84AKK37 pKa = 10.1GRR39 pKa = 11.84KK40 pKa = 8.83KK41 pKa = 10.63LSAA44 pKa = 3.95
MM1 pKa = 7.67KK2 pKa = 8.72MTFQPKK8 pKa = 8.95KK9 pKa = 7.58RR10 pKa = 11.84QRR12 pKa = 11.84SKK14 pKa = 9.17VHH16 pKa = 5.89GFRR19 pKa = 11.84ARR21 pKa = 11.84MSSAGGRR28 pKa = 11.84KK29 pKa = 8.76VLQARR34 pKa = 11.84RR35 pKa = 11.84AKK37 pKa = 10.1GRR39 pKa = 11.84KK40 pKa = 8.83KK41 pKa = 10.63LSAA44 pKa = 3.95
Molecular weight: 5.06 kDa
Isoelectric point according different methods:
Peptides (in silico digests for buttom-up proteomics)
Below you can find in silico digests of the whole proteome with Trypsin, Chymotrypsin, Trypsin+LysC, LysN, ArgC proteases suitable for different mass spec machines.| Try ESI |
 |
|---|
| ChTry ESI |
|
|---|
| ArgC ESI |
|
|---|
| LysN ESI |
|
|---|
| TryLysC ESI |
|
|---|
| Try MALDI |
|
|---|
| ChTry MALDI |
|
|---|
| ArgC MALDI |
|
|---|
| LysN MALDI |
|
|---|
| TryLysC MALDI |
|
|---|
| Try LTQ |
|
|---|
| ChTry LTQ |
|
|---|
| ArgC LTQ |
|
|---|
| LysN LTQ |
|
|---|
| TryLysC LTQ |
|
|---|
| Try MSlow |
|
|---|
| ChTry MSlow |
|
|---|
| ArgC MSlow |
|
|---|
| LysN MSlow |
|
|---|
| TryLysC MSlow |
|
|---|
| Try MShigh |
|
|---|
| ChTry MShigh |
|
|---|
| ArgC MShigh |
|
|---|
| LysN MShigh |
|
|---|
| TryLysC MShigh |
|
|---|
General Statistics
Number of major isoforms |
Number of additional isoforms |
Number of all proteins |
Number of amino acids |
Min. Seq. Length |
Max. Seq. Length |
Avg. Seq. Length |
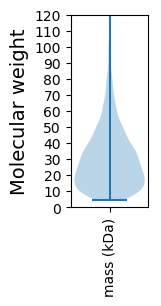
Avg. Mol. Weight |
|---|---|---|---|---|---|---|---|
0 |
819781 |
38 |
1974 |
280.9 |
31.67 |
Amino acid frequency
Ala |
Cys |
Asp |
Glu |
Phe |
Gly |
His |
Ile |
Lys |
Leu |
|---|---|---|---|---|---|---|---|---|---|
6.447 ± 0.054 | 1.512 ± 0.019 |
5.642 ± 0.035 | 7.545 ± 0.05 |
4.15 ± 0.033 | 6.577 ± 0.04 |
1.759 ± 0.018 | 7.961 ± 0.043 |
7.876 ± 0.038 | 9.112 ± 0.046 |
Met |
Asn |
Gln |
Pro |
Arg |
Ser |
Thr |
Val |
Trp |
Tyr |
|---|---|---|---|---|---|---|---|---|---|
2.954 ± 0.02 | 4.837 ± 0.035 |
3.095 ± 0.024 | 3.111 ± 0.028 |
3.765 ± 0.031 | 6.155 ± 0.039 |
5.52 ± 0.037 | 6.791 ± 0.04 |
0.862 ± 0.015 | 4.328 ± 0.033 |
Most of the basic statistics you can see at this page can be downloaded from this CSV file
See this proteome in:

Proteome-pI is available under Creative Commons Attribution-NoDerivs license, for more details see here
| Reference: Kozlowski LP. Proteome-pI 2.0: Proteome Isoelectric Point Database Update. Nucleic Acids Res. 2021, doi: 10.1093/nar/gkab944 | Contact: Lukasz P. Kozlowski |