Luteitalea pratensis
Taxonomy: cellular organisms; Bacteria; Acidobacteria; Vicinamibacteria; Vicinamibacteraceae; Luteitalea
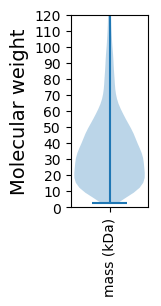
Average proteome isoelectric point is 6.93
Get precalculated fractions of proteins
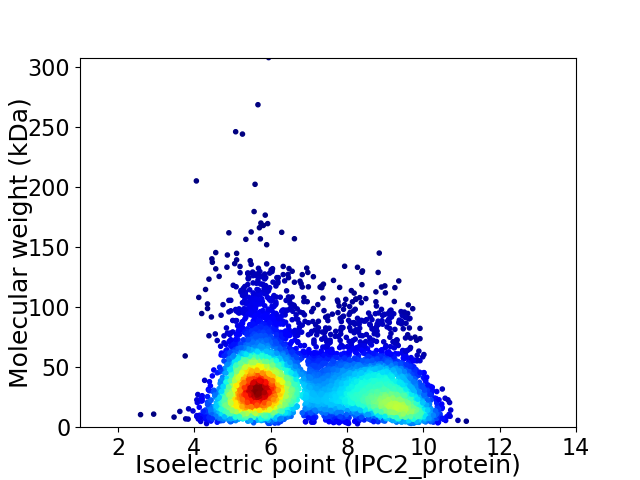
Virtual 2D-PAGE plot for 6189 proteins (isoelectric point calculated using IPC2_protein)
Get csv file with sequences according to given criteria:
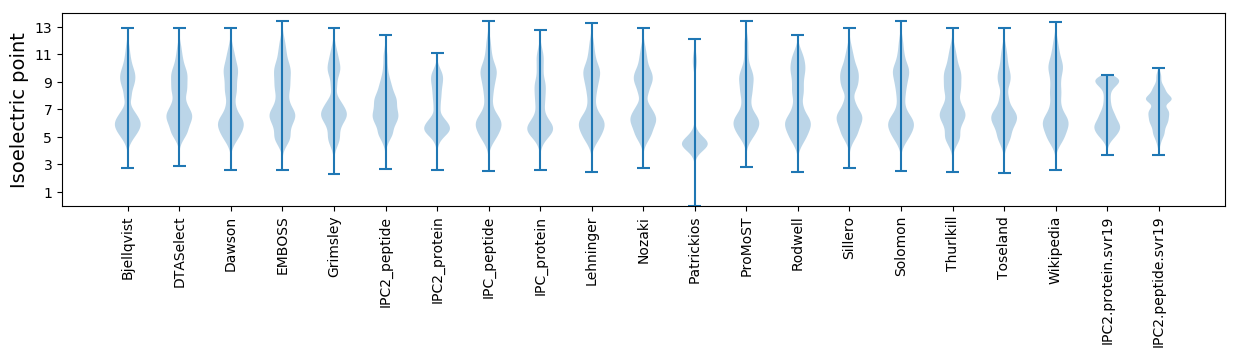
* You can choose from 21 different methods for calculating isoelectric point
Summary statistics related to proteome-wise predictions
Protein with the lowest isoelectric point:
>tr|A0A143PP57|A0A143PP57_9BACT Uncharacterized protein OS=Luteitalea pratensis OX=1855912 GN=LuPra_03710 PE=4 SV=1
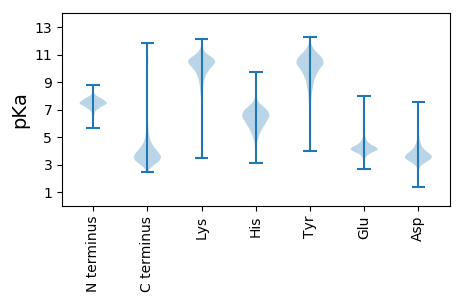
MM1 pKa = 7.36LCVYY5 pKa = 10.13CRR7 pKa = 11.84QQPVDD12 pKa = 3.88PRR14 pKa = 11.84WQPFCSEE21 pKa = 3.94RR22 pKa = 11.84CQWLDD27 pKa = 3.28LSHH30 pKa = 7.03WLDD33 pKa = 2.65GDD35 pKa = 3.91YY36 pKa = 10.6RR37 pKa = 11.84VEE39 pKa = 4.61GPADD43 pKa = 3.81DD44 pKa = 5.07TPPDD48 pKa = 4.06MDD50 pKa = 5.49PDD52 pKa = 4.18DD53 pKa = 5.44PEE55 pKa = 4.39ATDD58 pKa = 3.59LL59 pKa = 4.62
MM1 pKa = 7.36LCVYY5 pKa = 10.13CRR7 pKa = 11.84QQPVDD12 pKa = 3.88PRR14 pKa = 11.84WQPFCSEE21 pKa = 3.94RR22 pKa = 11.84CQWLDD27 pKa = 3.28LSHH30 pKa = 7.03WLDD33 pKa = 2.65GDD35 pKa = 3.91YY36 pKa = 10.6RR37 pKa = 11.84VEE39 pKa = 4.61GPADD43 pKa = 3.81DD44 pKa = 5.07TPPDD48 pKa = 4.06MDD50 pKa = 5.49PDD52 pKa = 4.18DD53 pKa = 5.44PEE55 pKa = 4.39ATDD58 pKa = 3.59LL59 pKa = 4.62
Molecular weight: 6.93 kDa
Isoelectric point according different methods:
Protein with the highest isoelectric point:
>tr|A0A143PPU9|A0A143PPU9_9BACT Uroporphyrinogen decarboxylase OS=Luteitalea pratensis OX=1855912 GN=hemE PE=3 SV=1
MM1 pKa = 7.36SRR3 pKa = 11.84PLVVLVLGVTALMALSWAVGRR24 pKa = 11.84VIFWLRR30 pKa = 11.84ATFPPNRR37 pKa = 11.84RR38 pKa = 11.84RR39 pKa = 11.84GRR41 pKa = 11.84RR42 pKa = 11.84RR43 pKa = 3.03
MM1 pKa = 7.36SRR3 pKa = 11.84PLVVLVLGVTALMALSWAVGRR24 pKa = 11.84VIFWLRR30 pKa = 11.84ATFPPNRR37 pKa = 11.84RR38 pKa = 11.84RR39 pKa = 11.84GRR41 pKa = 11.84RR42 pKa = 11.84RR43 pKa = 3.03
Molecular weight: 4.98 kDa
Isoelectric point according different methods:
Peptides (in silico digests for buttom-up proteomics)
Below you can find in silico digests of the whole proteome with Trypsin, Chymotrypsin, Trypsin+LysC, LysN, ArgC proteases suitable for different mass spec machines.| Try ESI |
 |
|---|
| ChTry ESI |
|
|---|
| ArgC ESI |
|
|---|
| LysN ESI |
|
|---|
| TryLysC ESI |
|
|---|
| Try MALDI |
|
|---|
| ChTry MALDI |
|
|---|
| ArgC MALDI |
|
|---|
| LysN MALDI |
|
|---|
| TryLysC MALDI |
|
|---|
| Try LTQ |
|
|---|
| ChTry LTQ |
|
|---|
| ArgC LTQ |
|
|---|
| LysN LTQ |
|
|---|
| TryLysC LTQ |
|
|---|
| Try MSlow |
|
|---|
| ChTry MSlow |
|
|---|
| ArgC MSlow |
|
|---|
| LysN MSlow |
|
|---|
| TryLysC MSlow |
|
|---|
| Try MShigh |
|
|---|
| ChTry MShigh |
|
|---|
| ArgC MShigh |
|
|---|
| LysN MShigh |
|
|---|
| TryLysC MShigh |
|
|---|
General Statistics
Number of major isoforms |
Number of additional isoforms |
Number of all proteins |
Number of amino acids |
Min. Seq. Length |
Max. Seq. Length |
Avg. Seq. Length |
Avg. Mol. Weight |
|---|---|---|---|---|---|---|---|
0 |
2193066 |
29 |
2794 |
354.3 |
38.35 |
Amino acid frequency
Ala |
Cys |
Asp |
Glu |
Phe |
Gly |
His |
Ile |
Lys |
Leu |
|---|---|---|---|---|---|---|---|---|---|
12.818 ± 0.044 | 0.765 ± 0.01 |
5.686 ± 0.02 | 4.978 ± 0.023 |
3.392 ± 0.019 | 8.644 ± 0.027 |
2.19 ± 0.014 | 3.984 ± 0.02 |
2.193 ± 0.023 | 10.034 ± 0.034 |
Met |
Asn |
Gln |
Pro |
Arg |
Ser |
Thr |
Val |
Trp |
Tyr |
|---|---|---|---|---|---|---|---|---|---|
2.052 ± 0.013 | 2.243 ± 0.025 |
5.775 ± 0.021 | 3.275 ± 0.018 |
8.229 ± 0.032 | 5.394 ± 0.023 |
6.061 ± 0.025 | 8.496 ± 0.025 |
1.543 ± 0.013 | 2.248 ± 0.015 |
Most of the basic statistics you can see at this page can be downloaded from this CSV file
See this proteome in:

Proteome-pI is available under Creative Commons Attribution-NoDerivs license, for more details see here
| Reference: Kozlowski LP. Proteome-pI 2.0: Proteome Isoelectric Point Database Update. Nucleic Acids Res. 2021, doi: 10.1093/nar/gkab944 | Contact: Lukasz P. Kozlowski |