Cutibacterium acnes JCM 18918
Taxonomy: cellular organisms; Bacteria; Terrabacteria group; Actinobacteria; Actinomycetia; Propionibacteriales; Propionibacteriaceae; Cutibacterium; Cutibacterium acnes
Average proteome isoelectric point is 6.75
Get precalculated fractions of proteins
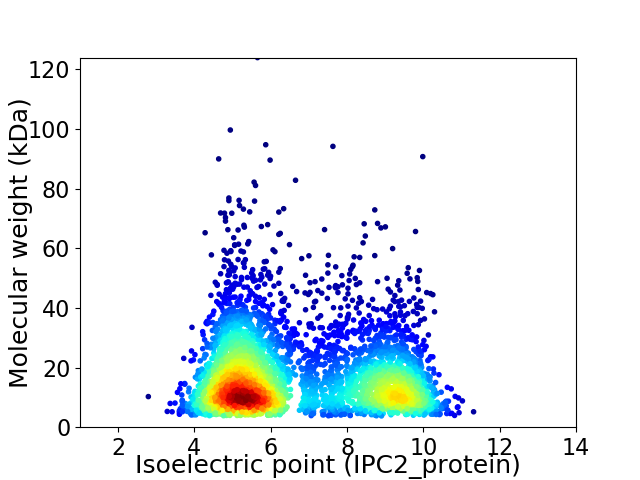
Virtual 2D-PAGE plot for 4111 proteins (isoelectric point calculated using IPC2_protein)
Get csv file with sequences according to given criteria:
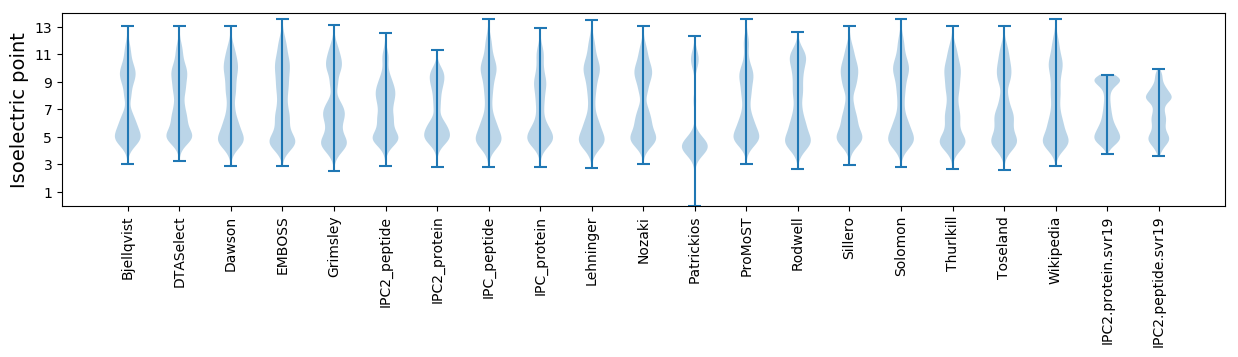
* You can choose from 21 different methods for calculating isoelectric point
Summary statistics related to proteome-wise predictions

Protein with the lowest isoelectric point:
>tr|W4U3B4|W4U3B4_CUTAC Heme O synthase OS=Cutibacterium acnes JCM 18918 OX=1302243 GN=JCM18918_787 PE=4 SV=1
MM1 pKa = 8.39DD2 pKa = 5.31SGLDD6 pKa = 4.81RR7 pKa = 11.84DD8 pKa = 4.41WLWDD12 pKa = 3.61DD13 pKa = 3.6WQDD16 pKa = 3.73ALDD19 pKa = 4.28GEE21 pKa = 4.73AVNDD25 pKa = 4.05CRR27 pKa = 11.84WNPCYY32 pKa = 10.56DD33 pKa = 3.92CGVCPQMGTEE43 pKa = 4.0IQVGPSGHH51 pKa = 6.81PLIPLTPVVPDD62 pKa = 3.9LAPSKK67 pKa = 10.32EE68 pKa = 3.97AA69 pKa = 4.15
MM1 pKa = 8.39DD2 pKa = 5.31SGLDD6 pKa = 4.81RR7 pKa = 11.84DD8 pKa = 4.41WLWDD12 pKa = 3.61DD13 pKa = 3.6WQDD16 pKa = 3.73ALDD19 pKa = 4.28GEE21 pKa = 4.73AVNDD25 pKa = 4.05CRR27 pKa = 11.84WNPCYY32 pKa = 10.56DD33 pKa = 3.92CGVCPQMGTEE43 pKa = 4.0IQVGPSGHH51 pKa = 6.81PLIPLTPVVPDD62 pKa = 3.9LAPSKK67 pKa = 10.32EE68 pKa = 3.97AA69 pKa = 4.15
Molecular weight: 7.6 kDa
Isoelectric point according different methods:
Protein with the highest isoelectric point:
>tr|W4U6B3|W4U6B3_CUTAC Membrane protein OS=Cutibacterium acnes JCM 18918 OX=1302243 GN=JCM18918_2508 PE=4 SV=1
MM1 pKa = 7.45KK2 pKa = 9.61RR3 pKa = 11.84TFQPSNRR10 pKa = 11.84RR11 pKa = 11.84RR12 pKa = 11.84ARR14 pKa = 11.84NHH16 pKa = 5.31GFRR19 pKa = 11.84SRR21 pKa = 11.84MSTRR25 pKa = 11.84AGRR28 pKa = 11.84SILAARR34 pKa = 11.84RR35 pKa = 11.84RR36 pKa = 11.84KK37 pKa = 10.31GRR39 pKa = 11.84VNLSAA44 pKa = 4.92
MM1 pKa = 7.45KK2 pKa = 9.61RR3 pKa = 11.84TFQPSNRR10 pKa = 11.84RR11 pKa = 11.84RR12 pKa = 11.84ARR14 pKa = 11.84NHH16 pKa = 5.31GFRR19 pKa = 11.84SRR21 pKa = 11.84MSTRR25 pKa = 11.84AGRR28 pKa = 11.84SILAARR34 pKa = 11.84RR35 pKa = 11.84RR36 pKa = 11.84KK37 pKa = 10.31GRR39 pKa = 11.84VNLSAA44 pKa = 4.92
Molecular weight: 5.17 kDa
Isoelectric point according different methods:
Peptides (in silico digests for buttom-up proteomics)
Below you can find in silico digests of the whole proteome with Trypsin, Chymotrypsin, Trypsin+LysC, LysN, ArgC proteases suitable for different mass spec machines.| Try ESI |
 |
|---|
| ChTry ESI |
|
|---|
| ArgC ESI |
|
|---|
| LysN ESI |
|
|---|
| TryLysC ESI |
|
|---|
| Try MALDI |
|
|---|
| ChTry MALDI |
|
|---|
| ArgC MALDI |
|
|---|
| LysN MALDI |
|
|---|
| TryLysC MALDI |
|
|---|
| Try LTQ |
|
|---|
| ChTry LTQ |
|
|---|
| ArgC LTQ |
|
|---|
| LysN LTQ |
|
|---|
| TryLysC LTQ |
|
|---|
| Try MSlow |
|
|---|
| ChTry MSlow |
|
|---|
| ArgC MSlow |
|
|---|
| LysN MSlow |
|
|---|
| TryLysC MSlow |
|
|---|
| Try MShigh |
|
|---|
| ChTry MShigh |
|
|---|
| ArgC MShigh |
|
|---|
| LysN MShigh |
|
|---|
| TryLysC MShigh |
|
|---|
General Statistics
Number of major isoforms |
Number of additional isoforms |
Number of all proteins |
Number of amino acids |
Min. Seq. Length |
Max. Seq. Length |
Avg. Seq. Length |
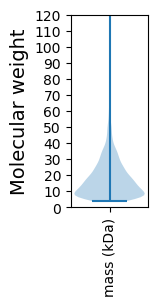
Avg. Mol. Weight |
|---|---|---|---|---|---|---|---|
0 |
696319 |
37 |
1120 |
169.4 |
18.4 |
Amino acid frequency
Ala |
Cys |
Asp |
Glu |
Phe |
Gly |
His |
Ile |
Lys |
Leu |
|---|---|---|---|---|---|---|---|---|---|
10.609 ± 0.046 | 1.394 ± 0.018 |
5.929 ± 0.041 | 4.955 ± 0.04 |
2.852 ± 0.028 | 8.271 ± 0.038 |
2.508 ± 0.021 | 4.751 ± 0.036 |
2.797 ± 0.032 | 9.254 ± 0.046 |
Met |
Asn |
Gln |
Pro |
Arg |
Ser |
Thr |
Val |
Trp |
Tyr |
|---|---|---|---|---|---|---|---|---|---|
2.686 ± 0.022 | 2.419 ± 0.022 |
5.684 ± 0.033 | 2.95 ± 0.022 |
7.446 ± 0.045 | 6.889 ± 0.039 |
6.433 ± 0.035 | 8.501 ± 0.044 |
1.763 ± 0.021 | 1.911 ± 0.022 |
Most of the basic statistics you can see at this page can be downloaded from this CSV file
See this proteome in:

Proteome-pI is available under Creative Commons Attribution-NoDerivs license, for more details see here
| Reference: Kozlowski LP. Proteome-pI 2.0: Proteome Isoelectric Point Database Update. Nucleic Acids Res. 2021, doi: 10.1093/nar/gkab944 | Contact: Lukasz P. Kozlowski |