Pseudomonas phage LUZ24
Taxonomy: Viruses; Duplodnaviria; Heunggongvirae; Uroviricota; Caudoviricetes; Caudovirales; Podoviridae; Bruynoghevirus
Average proteome isoelectric point is 6.13
Get precalculated fractions of proteins
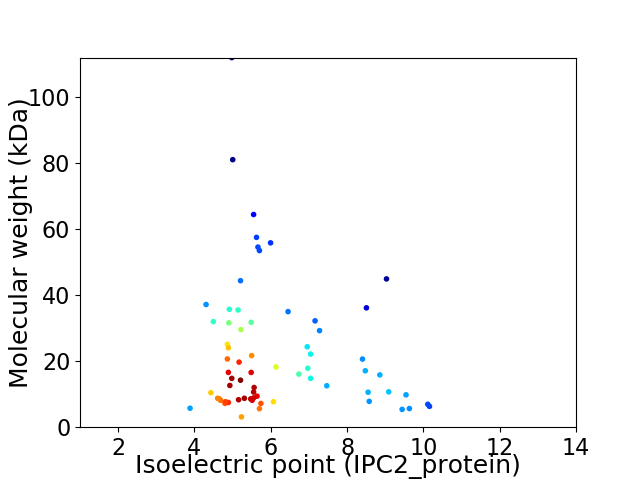
Virtual 2D-PAGE plot for 68 proteins (isoelectric point calculated using IPC2_protein)
Get csv file with sequences according to given criteria:
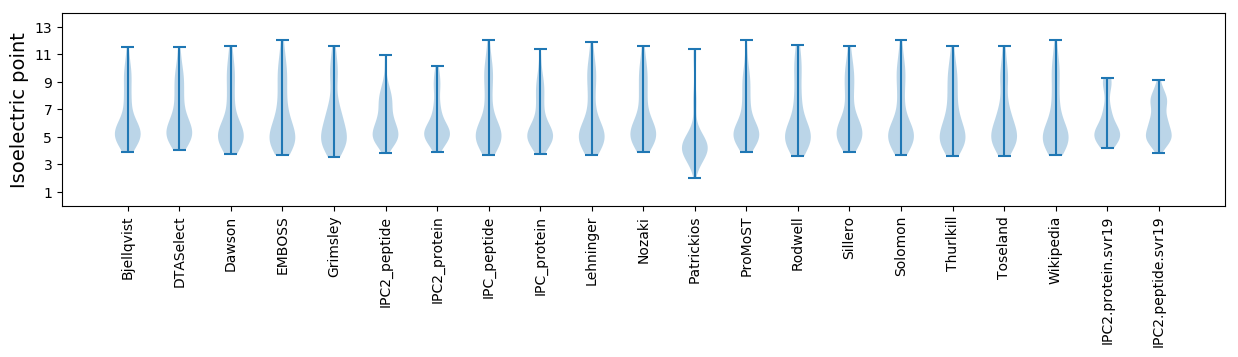
* You can choose from 21 different methods for calculating isoelectric point
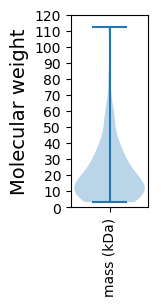
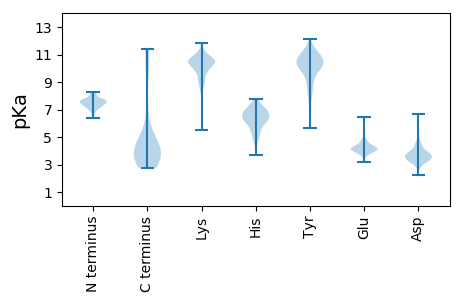
Summary statistics related to proteome-wise predictions
Protein with the lowest isoelectric point:
>tr|A9J6Z2|A9J6Z2_BPLUZ Uncharacterized protein gp30 OS=Pseudomonas phage LUZ24 OX=484895 GN=gp30 PE=4 SV=1
MM1 pKa = 7.53ASKK4 pKa = 10.65KK5 pKa = 10.38EE6 pKa = 4.05SLEE9 pKa = 4.0DD10 pKa = 3.66QAWKK14 pKa = 10.46EE15 pKa = 3.53IALEE19 pKa = 4.32KK20 pKa = 10.42EE21 pKa = 4.86FSGSWGGPEE30 pKa = 4.13IDD32 pKa = 5.3ADD34 pKa = 4.14DD35 pKa = 4.73FPLGSACDD43 pKa = 4.21LDD45 pKa = 4.59PEE47 pKa = 4.56VCEE50 pKa = 4.43SCSS53 pKa = 3.26
MM1 pKa = 7.53ASKK4 pKa = 10.65KK5 pKa = 10.38EE6 pKa = 4.05SLEE9 pKa = 4.0DD10 pKa = 3.66QAWKK14 pKa = 10.46EE15 pKa = 3.53IALEE19 pKa = 4.32KK20 pKa = 10.42EE21 pKa = 4.86FSGSWGGPEE30 pKa = 4.13IDD32 pKa = 5.3ADD34 pKa = 4.14DD35 pKa = 4.73FPLGSACDD43 pKa = 4.21LDD45 pKa = 4.59PEE47 pKa = 4.56VCEE50 pKa = 4.43SCSS53 pKa = 3.26
Molecular weight: 5.75 kDa
Isoelectric point according different methods:
Protein with the highest isoelectric point:
>tr|A9J6T8|A9J6T8_BPLUZ Uncharacterized protein gp2 OS=Pseudomonas phage LUZ24 OX=484895 GN=gp2 PE=4 SV=1
MM1 pKa = 7.24YY2 pKa = 10.33LLEE5 pKa = 4.18GLKK8 pKa = 10.75VKK10 pKa = 10.34GKK12 pKa = 9.04PKK14 pKa = 10.26QRR16 pKa = 11.84TAVYY20 pKa = 9.96KK21 pKa = 10.66GGRR24 pKa = 11.84KK25 pKa = 6.31TAKK28 pKa = 9.78TDD30 pKa = 2.76IHH32 pKa = 6.55RR33 pKa = 11.84NNRR36 pKa = 11.84KK37 pKa = 9.44SVFGSPRR44 pKa = 11.84LGRR47 pKa = 11.84NPLDD51 pKa = 3.26ILINSS56 pKa = 4.13
MM1 pKa = 7.24YY2 pKa = 10.33LLEE5 pKa = 4.18GLKK8 pKa = 10.75VKK10 pKa = 10.34GKK12 pKa = 9.04PKK14 pKa = 10.26QRR16 pKa = 11.84TAVYY20 pKa = 9.96KK21 pKa = 10.66GGRR24 pKa = 11.84KK25 pKa = 6.31TAKK28 pKa = 9.78TDD30 pKa = 2.76IHH32 pKa = 6.55RR33 pKa = 11.84NNRR36 pKa = 11.84KK37 pKa = 9.44SVFGSPRR44 pKa = 11.84LGRR47 pKa = 11.84NPLDD51 pKa = 3.26ILINSS56 pKa = 4.13
Molecular weight: 6.32 kDa
Isoelectric point according different methods:
Peptides (in silico digests for buttom-up proteomics)
Below you can find in silico digests of the whole proteome with Trypsin, Chymotrypsin, Trypsin+LysC, LysN, ArgC proteases suitable for different mass spec machines.| Try ESI |
 |
|---|
| ChTry ESI |
|
|---|
| ArgC ESI |
|
|---|
| LysN ESI |
|
|---|
| TryLysC ESI |
|
|---|
| Try MALDI |
|
|---|
| ChTry MALDI |
|
|---|
| ArgC MALDI |
|
|---|
| LysN MALDI |
|
|---|
| TryLysC MALDI |
|
|---|
| Try LTQ |
|
|---|
| ChTry LTQ |
|
|---|
| ArgC LTQ |
|
|---|
| LysN LTQ |
|
|---|
| TryLysC LTQ |
|
|---|
| Try MSlow |
|
|---|
| ChTry MSlow |
|
|---|
| ArgC MSlow |
|
|---|
| LysN MSlow |
|
|---|
| TryLysC MSlow |
|
|---|
| Try MShigh |
|
|---|
| ChTry MShigh |
|
|---|
| ArgC MShigh |
|
|---|
| LysN MShigh |
|
|---|
| TryLysC MShigh |
|
|---|
General Statistics
Number of major isoforms |
Number of additional isoforms |
Number of all proteins |
Number of amino acids |
Min. Seq. Length |
Max. Seq. Length |
Avg. Seq. Length |
Avg. Mol. Weight |
|---|---|---|---|---|---|---|---|
0 |
13674 |
27 |
1055 |
201.1 |
22.45 |
Amino acid frequency
Ala |
Cys |
Asp |
Glu |
Phe |
Gly |
His |
Ile |
Lys |
Leu |
|---|---|---|---|---|---|---|---|---|---|
8.227 ± 0.52 | 1.134 ± 0.184 |
6.055 ± 0.218 | 7.167 ± 0.466 |
3.817 ± 0.203 | 8.308 ± 0.433 |
2.084 ± 0.233 | 5.119 ± 0.188 |
5.682 ± 0.275 | 8.213 ± 0.263 |
Met |
Asn |
Gln |
Pro |
Arg |
Ser |
Thr |
Val |
Trp |
Tyr |
|---|---|---|---|---|---|---|---|---|---|
2.72 ± 0.168 | 4.351 ± 0.248 |
4.315 ± 0.22 | 4.015 ± 0.284 |
5.872 ± 0.312 | 5.792 ± 0.286 |
5.222 ± 0.29 | 6.984 ± 0.219 |
1.719 ± 0.133 | 3.203 ± 0.179 |
Most of the basic statistics you can see at this page can be downloaded from this CSV file
See this proteome in:

Proteome-pI is available under Creative Commons Attribution-NoDerivs license, for more details see here
| Reference: Kozlowski LP. Proteome-pI 2.0: Proteome Isoelectric Point Database Update. Nucleic Acids Res. 2021, doi: 10.1093/nar/gkab944 | Contact: Lukasz P. Kozlowski |