Pseudonocardia sp. HH130629-09
Taxonomy: cellular organisms; Bacteria; Terrabacteria group; Actinobacteria; Actinomycetia; Pseudonocardiales; Pseudonocardiaceae; Pseudonocardia; unclassified Pseudonocardia
Average proteome isoelectric point is 6.26
Get precalculated fractions of proteins
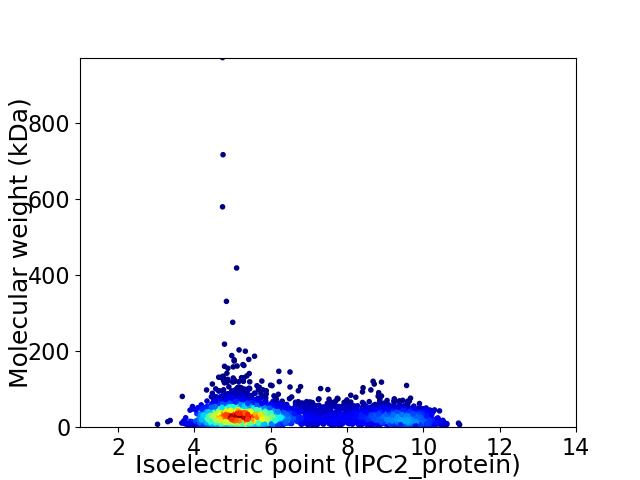
Virtual 2D-PAGE plot for 4780 proteins (isoelectric point calculated using IPC2_protein)
Get csv file with sequences according to given criteria:
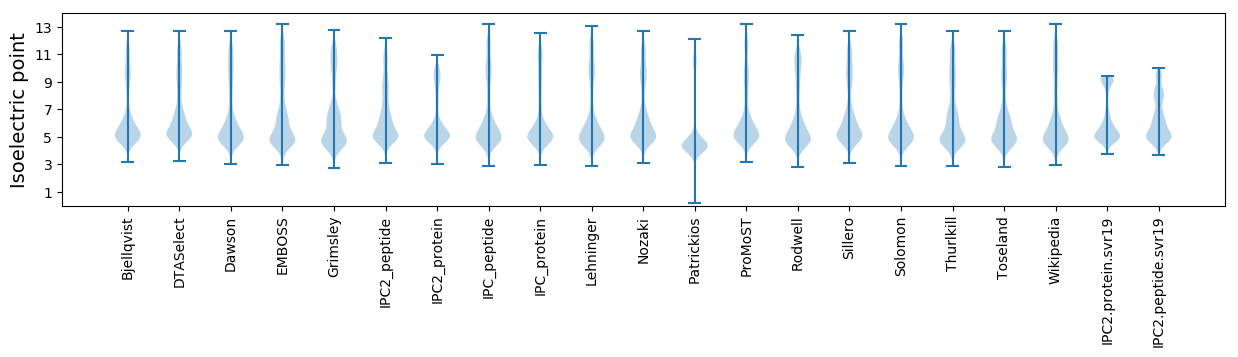
* You can choose from 21 different methods for calculating isoelectric point
Summary statistics related to proteome-wise predictions
Protein with the lowest isoelectric point:
>tr|A0A0M3UB28|A0A0M3UB28_9PSEU Luciferase OS=Pseudonocardia sp. HH130629-09 OX=1641402 GN=XF36_10420 PE=4 SV=1
MM1 pKa = 7.79ALQLDD6 pKa = 4.12PQLLEE11 pKa = 5.06ILACPCDD18 pKa = 3.54AHH20 pKa = 7.45AVLTPGEE27 pKa = 4.24DD28 pKa = 3.11RR29 pKa = 11.84LTCTACGRR37 pKa = 11.84AFPVTDD43 pKa = 5.51GIPVLLLDD51 pKa = 4.18EE52 pKa = 5.17ALPGTGPAGDD62 pKa = 4.2GRR64 pKa = 11.84DD65 pKa = 3.7DD66 pKa = 3.67GG67 pKa = 4.63
MM1 pKa = 7.79ALQLDD6 pKa = 4.12PQLLEE11 pKa = 5.06ILACPCDD18 pKa = 3.54AHH20 pKa = 7.45AVLTPGEE27 pKa = 4.24DD28 pKa = 3.11RR29 pKa = 11.84LTCTACGRR37 pKa = 11.84AFPVTDD43 pKa = 5.51GIPVLLLDD51 pKa = 4.18EE52 pKa = 5.17ALPGTGPAGDD62 pKa = 4.2GRR64 pKa = 11.84DD65 pKa = 3.7DD66 pKa = 3.67GG67 pKa = 4.63
Molecular weight: 6.86 kDa
Isoelectric point according different methods:
Protein with the highest isoelectric point:
>tr|A0A0M4QED5|A0A0M4QED5_9PSEU Uncharacterized protein OS=Pseudonocardia sp. HH130629-09 OX=1641402 GN=XF36_25585 PE=4 SV=1
MM1 pKa = 7.58SSTATSKK8 pKa = 11.18APASSPWPKK17 pKa = 10.83SPMPWTRR24 pKa = 11.84NVKK27 pKa = 10.48FSRR30 pKa = 11.84PPSAASRR37 pKa = 11.84VASAARR43 pKa = 11.84APFGSMPTTSRR54 pKa = 11.84HH55 pKa = 5.34RR56 pKa = 11.84PASSSAVV63 pKa = 3.29
MM1 pKa = 7.58SSTATSKK8 pKa = 11.18APASSPWPKK17 pKa = 10.83SPMPWTRR24 pKa = 11.84NVKK27 pKa = 10.48FSRR30 pKa = 11.84PPSAASRR37 pKa = 11.84VASAARR43 pKa = 11.84APFGSMPTTSRR54 pKa = 11.84HH55 pKa = 5.34RR56 pKa = 11.84PASSSAVV63 pKa = 3.29
Molecular weight: 6.57 kDa
Isoelectric point according different methods:
Peptides (in silico digests for buttom-up proteomics)
Below you can find in silico digests of the whole proteome with Trypsin, Chymotrypsin, Trypsin+LysC, LysN, ArgC proteases suitable for different mass spec machines.| Try ESI |
 |
|---|
| ChTry ESI |
|
|---|
| ArgC ESI |
|
|---|
| LysN ESI |
|
|---|
| TryLysC ESI |
|
|---|
| Try MALDI |
|
|---|
| ChTry MALDI |
|
|---|
| ArgC MALDI |
|
|---|
| LysN MALDI |
|
|---|
| TryLysC MALDI |
|
|---|
| Try LTQ |
|
|---|
| ChTry LTQ |
|
|---|
| ArgC LTQ |
|
|---|
| LysN LTQ |
|
|---|
| TryLysC LTQ |
|
|---|
| Try MSlow |
|
|---|
| ChTry MSlow |
|
|---|
| ArgC MSlow |
|
|---|
| LysN MSlow |
|
|---|
| TryLysC MSlow |
|
|---|
| Try MShigh |
|
|---|
| ChTry MShigh |
|
|---|
| ArgC MShigh |
|
|---|
| LysN MShigh |
|
|---|
| TryLysC MShigh |
|
|---|
General Statistics
Number of major isoforms |
Number of additional isoforms |
Number of all proteins |
Number of amino acids |
Min. Seq. Length |
Max. Seq. Length |
Avg. Seq. Length |
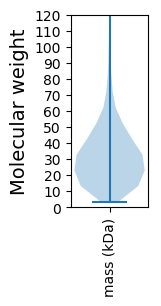
Avg. Mol. Weight |
|---|---|---|---|---|---|---|---|
0 |
1499939 |
30 |
9453 |
313.8 |
33.31 |
Amino acid frequency
Ala |
Cys |
Asp |
Glu |
Phe |
Gly |
His |
Ile |
Lys |
Leu |
|---|---|---|---|---|---|---|---|---|---|
14.153 ± 0.063 | 0.744 ± 0.01 |
6.535 ± 0.03 | 5.297 ± 0.037 |
2.557 ± 0.02 | 9.873 ± 0.036 |
2.256 ± 0.018 | 2.959 ± 0.028 |
1.375 ± 0.026 | 10.353 ± 0.043 |
Met |
Asn |
Gln |
Pro |
Arg |
Ser |
Thr |
Val |
Trp |
Tyr |
|---|---|---|---|---|---|---|---|---|---|
1.63 ± 0.012 | 1.472 ± 0.018 |
6.322 ± 0.04 | 2.354 ± 0.018 |
8.521 ± 0.046 | 4.684 ± 0.025 |
6.178 ± 0.026 | 9.578 ± 0.035 |
1.449 ± 0.013 | 1.711 ± 0.017 |
Most of the basic statistics you can see at this page can be downloaded from this CSV file
See this proteome in:

Proteome-pI is available under Creative Commons Attribution-NoDerivs license, for more details see here
| Reference: Kozlowski LP. Proteome-pI 2.0: Proteome Isoelectric Point Database Update. Nucleic Acids Res. 2021, doi: 10.1093/nar/gkab944 | Contact: Lukasz P. Kozlowski |