Thermogutta terrifontis
Taxonomy: cellular organisms; Bacteria; PVC group; Planctomycetes; Planctomycetia; Pirellulales; Thermoguttaceae; Thermogutta
Average proteome isoelectric point is 6.9
Get precalculated fractions of proteins
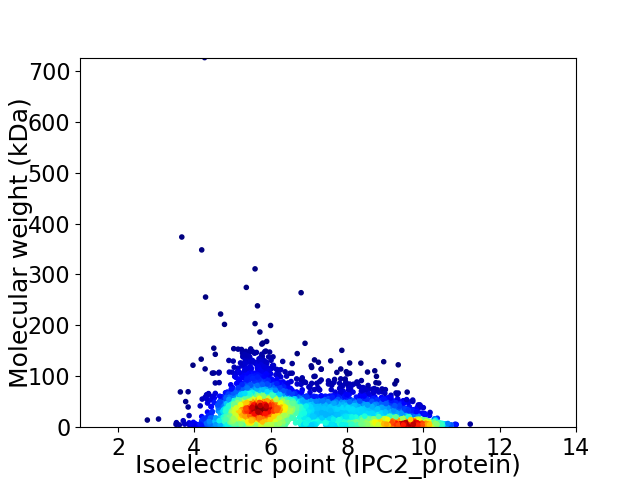
Virtual 2D-PAGE plot for 4494 proteins (isoelectric point calculated using IPC2_protein)
Get csv file with sequences according to given criteria:
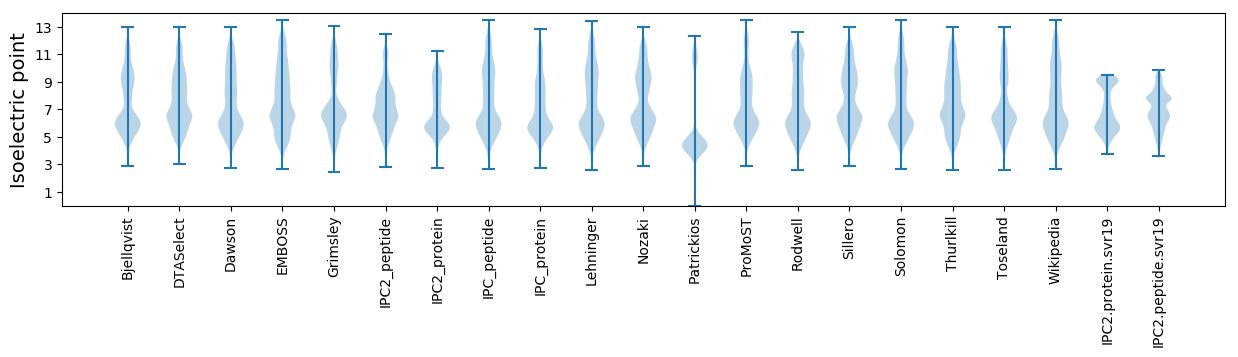
* You can choose from 21 different methods for calculating isoelectric point
Summary statistics related to proteome-wise predictions
Protein with the lowest isoelectric point:
>tr|A0A286RH97|A0A286RH97_9BACT Uncharacterized protein OS=Thermogutta terrifontis OX=1331910 GN=THTE_2710 PE=4 SV=1
MM1 pKa = 7.21YY2 pKa = 9.45PSDD5 pKa = 5.68DD6 pKa = 4.1SPQTTAPRR14 pKa = 11.84EE15 pKa = 3.97FPITHH20 pKa = 6.83PLVYY24 pKa = 10.05PSDD27 pKa = 5.04DD28 pKa = 3.98SPQTTADD35 pKa = 3.88FRR37 pKa = 11.84PLHH40 pKa = 5.6QNQLVYY46 pKa = 10.5PSDD49 pKa = 5.02DD50 pKa = 3.81SPQTTAFSAAGDD62 pKa = 4.04GEE64 pKa = 4.67KK65 pKa = 9.78IVYY68 pKa = 9.55PSDD71 pKa = 5.06DD72 pKa = 3.87SPQTTAGG79 pKa = 3.41
MM1 pKa = 7.21YY2 pKa = 9.45PSDD5 pKa = 5.68DD6 pKa = 4.1SPQTTAPRR14 pKa = 11.84EE15 pKa = 3.97FPITHH20 pKa = 6.83PLVYY24 pKa = 10.05PSDD27 pKa = 5.04DD28 pKa = 3.98SPQTTADD35 pKa = 3.88FRR37 pKa = 11.84PLHH40 pKa = 5.6QNQLVYY46 pKa = 10.5PSDD49 pKa = 5.02DD50 pKa = 3.81SPQTTAFSAAGDD62 pKa = 4.04GEE64 pKa = 4.67KK65 pKa = 9.78IVYY68 pKa = 9.55PSDD71 pKa = 5.06DD72 pKa = 3.87SPQTTAGG79 pKa = 3.41
Molecular weight: 8.57 kDa
Isoelectric point according different methods:
Protein with the highest isoelectric point:
>tr|A0A286REX7|A0A286REX7_9BACT Uncharacterized protein OS=Thermogutta terrifontis OX=1331910 GN=THTE_1902 PE=4 SV=1
MM1 pKa = 7.47ARR3 pKa = 11.84IAQVAGPRR11 pKa = 11.84ASRR14 pKa = 11.84AAFLLRR20 pKa = 11.84RR21 pKa = 11.84SNRR24 pKa = 11.84WKK26 pKa = 10.57LRR28 pKa = 11.84RR29 pKa = 11.84HH30 pKa = 6.29FSNIPPNLHH39 pKa = 5.61TRR41 pKa = 11.84NKK43 pKa = 10.18RR44 pKa = 11.84NRR46 pKa = 11.84TLVWPP51 pKa = 4.69
MM1 pKa = 7.47ARR3 pKa = 11.84IAQVAGPRR11 pKa = 11.84ASRR14 pKa = 11.84AAFLLRR20 pKa = 11.84RR21 pKa = 11.84SNRR24 pKa = 11.84WKK26 pKa = 10.57LRR28 pKa = 11.84RR29 pKa = 11.84HH30 pKa = 6.29FSNIPPNLHH39 pKa = 5.61TRR41 pKa = 11.84NKK43 pKa = 10.18RR44 pKa = 11.84NRR46 pKa = 11.84TLVWPP51 pKa = 4.69
Molecular weight: 6.09 kDa
Isoelectric point according different methods:
Peptides (in silico digests for buttom-up proteomics)
Below you can find in silico digests of the whole proteome with Trypsin, Chymotrypsin, Trypsin+LysC, LysN, ArgC proteases suitable for different mass spec machines.| Try ESI |
 |
|---|
| ChTry ESI |
|
|---|
| ArgC ESI |
|
|---|
| LysN ESI |
|
|---|
| TryLysC ESI |
|
|---|
| Try MALDI |
|
|---|
| ChTry MALDI |
|
|---|
| ArgC MALDI |
|
|---|
| LysN MALDI |
|
|---|
| TryLysC MALDI |
|
|---|
| Try LTQ |
|
|---|
| ChTry LTQ |
|
|---|
| ArgC LTQ |
|
|---|
| LysN LTQ |
|
|---|
| TryLysC LTQ |
|
|---|
| Try MSlow |
|
|---|
| ChTry MSlow |
|
|---|
| ArgC MSlow |
|
|---|
| LysN MSlow |
|
|---|
| TryLysC MSlow |
|
|---|
| Try MShigh |
|
|---|
| ChTry MShigh |
|
|---|
| ArgC MShigh |
|
|---|
| LysN MShigh |
|
|---|
| TryLysC MShigh |
|
|---|
General Statistics
Number of major isoforms |
Number of additional isoforms |
Number of all proteins |
Number of amino acids |
Min. Seq. Length |
Max. Seq. Length |
Avg. Seq. Length |
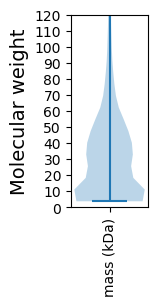
Avg. Mol. Weight |
|---|---|---|---|---|---|---|---|
0 |
1372611 |
37 |
6758 |
305.4 |
33.93 |
Amino acid frequency
Ala |
Cys |
Asp |
Glu |
Phe |
Gly |
His |
Ile |
Lys |
Leu |
|---|---|---|---|---|---|---|---|---|---|
9.435 ± 0.039 | 1.319 ± 0.018 |
5.012 ± 0.036 | 6.612 ± 0.045 |
3.774 ± 0.022 | 7.792 ± 0.047 |
2.143 ± 0.018 | 4.977 ± 0.026 |
3.484 ± 0.029 | 10.087 ± 0.053 |
Met |
Asn |
Gln |
Pro |
Arg |
Ser |
Thr |
Val |
Trp |
Tyr |
|---|---|---|---|---|---|---|---|---|---|
1.945 ± 0.018 | 2.793 ± 0.034 |
6.224 ± 0.038 | 4.037 ± 0.024 |
7.704 ± 0.039 | 5.433 ± 0.033 |
5.144 ± 0.032 | 7.608 ± 0.035 |
1.857 ± 0.024 | 2.62 ± 0.024 |
Most of the basic statistics you can see at this page can be downloaded from this CSV file
See this proteome in:

Proteome-pI is available under Creative Commons Attribution-NoDerivs license, for more details see here
| Reference: Kozlowski LP. Proteome-pI 2.0: Proteome Isoelectric Point Database Update. Nucleic Acids Res. 2021, doi: 10.1093/nar/gkab944 | Contact: Lukasz P. Kozlowski |